Global

This sub-category will have content that discusses what’s happening in the global market. It will also cover the global markets, their indices and more.

The news of China’s stimulus package to shore up the falling economy boosted the global stock market. Also, the outperformance in technology, chemical, and material stocks supported the market to move higher on expectations of a rebound in Chinese demand.

Crude Oil has found some support and was steady during the week. Brent Crude gained close to 1% during the week and is trading close to $75 level. On the other hand, Gold is continuing to experience upward pressure in prices and has gained 3% during the week, taking the total yearly gains to close to 30%. 

Now, let’s take a look at how the major stock market indices did this week.

IndexPrevious Day Change (%)WoW Change (%)
US Markets
Dow Jones0.330.59
S&P 500-0.130.62
Nasdaq-0.390.95
European Markets
FTSE 1000.430.62
CAC 400.643.88
DAX1.214.74
Asian Markets
Nifty 50 -0.161.09
Nikkei 2252.277.51
Straits Times-0.253.84
Hang Seng3.4318.19
Taiwan Weighted-0.168.20
KOSPI-0.822.67
SET Composite-0.346.20
Jakarta Composite-0.620.31
Shanghai Composite2.8010.89

The US stock market indices were steady during the week and gained slightly during the week. Cooling inflation data has once again sparked optimism for further rate cuts and accommodative monetary policy. However, the news of falling consumer confidence in August resulted in a bit of volatility in the market. 

Let’s check how the top US indices performed during the week. 

Dow Jones

Supported by cooling inflation data, the Dow Jones Industrial Average hit a new record high level on Friday. It was up by 0.33% at the end of the day, and on a weekly basis, the index was up by 0.59%. 

S&P 500

The release of consumer confidence and weaker-than-expected personal spending and personal income reports put some pressure on the S & P 500 index on Friday. It closed 0.13% lower. On a week-on-week basis, the index gained 0.62%, maintaining the positive momentum.  

Nasdaq

Profit booking in top tech stocks like Nvidia, AMD, and Micron pulled the index down on Friday and closed 0.39% lower. But, on a week-on-week basis, the index was up by 1%. 

Following the global cues, the European stock market traded with a positive bias. However, the fading of the Olympic effect has resulted in shrinking of business activity in the Eurozone area in September. Manufacturing activity is contracting at a faster pace, which is a cause of worry for investors. 

Now, let’s look, how different economies performed during the week. 

FTSE 100

The UK economy is showing signs of improvement as Private sector activity has now expanded for the 11th month in running. Inflation has now eased across the economy to a 42-month low level. On Friday, FTSE 100 traded sideways, but was steady. It increased by 0.43% and on a week-on-week basis, it was up by 0.62%.

CAC 40

Gains in consumer goods, technology, and consumer services drove France’s primary stock market index, CAC 40 higher during the week. In Friday’s session, it was up by 0.64% and on a weekly basis, the index was up by 3.88%. 

DAX

German business activity has declined the most in seven months as business morale and consumer confidence remained low in September, adding to signs that the economy might be entering a recession. 

However, the German stock market traded on a positive note, following the global cues. On Friday, DAX was up by 1.21% and on a week-on-week basis, the index was up by close to 5%. 

The leading Asian stock market indices were fuelled by rising expectations of accomodative monetary policy from the Fed and China’s economic stimulus. Also, domestic factors contributed to the rising market. 

Let’s now have a look, how the major stock market index performed during the week. 

Nifty 50

The Nifty 50 continues to trade with a positive bias, and once again reached a new all-time high level. On Friday, the index closed slightly lower by 0.16% on account of profit booking from the higher level. But, on a week-on-week basis, Nifty 50 gave a positive closing at 1.09%.

Nikkei 225

Supportive global factors, and dovish Bank of Japan are providing favorable support to the Japanese stock market. Nikkei 225 closed 2.27% higher at the close on Friday, and the week and the index closed 7.51% higher. 

Straits Times

Singapore’s primary stock market index, Straits Times traded sideways during Friday’s session and was slightly down by 0.25% and on a week-on-week basis, it closed higher by 3.84%.

Hang Seng

Chinese stocks surged after Beijing announced the economic stimulus package. The stocks in Hong Kong stock market also benefited. On Friday, Hang Seng index was up by 3.43%, taking the weekly cumulative gains to 18.19%. 

Taiwan Weighted

Taiwan’s primary stock market index, Taiwan Weighted Index, traded flat on Friday, and was slightly down by 0.16%. On a week-on-week basis, it was up by 8.20%. 

KOSPI

Profit booking in South Korean shares led the country’s primary stock market index, KOSPI, to trade lower, down 0.82%. However, it closed the week on a positive note, up 2.67%. 

SET Composite

Thai stocks traded flat on Friday, closing down 0.34%. However, on a weekly basis, the index rose 6.20%, allowing it to maintain its strong bullish momentum for another week.

Jakarta Composite

The Indonesian stock market index, Jakarta Composite, fell 0.62% on Friday. On a weekly basis, the index rose 0.31%.

Shanghai Composite

The Shanghai Composite Index climbed 10.89% at the end of the week, marking the best ever performance by the index in recent times. On Friday, the index was up by 2.80%. 

Wrapping Up

The global stock markets have shown positive momentum this week, largely fueled by China’s stimulus package aimed at reviving its economy. Sectors like technology, chemicals, and materials saw significant gains on hopes of increased Chinese demand. Crude oil prices also stabilized, while gold continued its upward trend, reflecting growing investor interest.

Despite these positive signs, the road ahead remains uncertain. Investors should stay cautious and keep an eye on global developments as market dynamics evolve in the coming weeks.

The global market celebrated the Federal Reserve’s 50 bps rate cut this week, as stocks moved to new higher levels except the European market.

It was the Fed’s first rate cut in four years, and it also kicked off the rate-cutting cycle this decade. The Fed struck a balance between not fueling inflation further and boosting slowing economic growth by implementing an unusual higher percentage point rate cut. 

Overall, market sentiment is improving, and as economic conditions improve, we may see more growth in the market; however, volatility is likely to persist. 

In the last week, Brent Crude has gained some ground after sliding below $70 level. It has gained close to 5% this week. On the other hand, Gold prices also hit new higher levels and has gained nearly 5.5% this week, as risk aversion sentiment persists. 

Let’s take a look at how the major stock market indices did this week.

IndexPrevious Day Change (%)WoW Change (%)
US Markets
Dow Jones0.091.62
S&P 500-0.191.36
Nasdaq-0.361.49
European Markets
FTSE 100-1.20-0.48
CAC 40-1.54-0.01
DAX-1.510.69
Asian Markets
Nifty 50 1.481.55
Nikkei 2251.512.28
Straits Times-0.235.33
Hang Seng1.344.59
Taiwan Weighted0.535.06
KOSPI0.480.49
SET Composite-0.226.31
Jakarta Composite-2.100.91
Shanghai Composite0.03-1.70
Source: Moneycontrol.com

Profit booking on Friday’s session led to some reversal of Thursday’s gain as traders and investors assess the 50 bps rate cut by Fed, as many think this aggressive rate cut must be due to some hidden economic risks. Overall, during Friday’s session, industrial and utility stocks fell the most. 

Let’s check how the top US indices performed during the week. 

Dow Jones

Dow Jones is currently trading near its record high level, looking for additional catalysts to break higher. The index traded flat on Friday, but on a weekly basis, it closed 1.62% higher.

S&P 500

S&P 500 index faced resistance as it failed to go past its record high levels. In Friday’s session, Fedex was the biggest loser of the index and was down by 14.12% on weak earnings report. While, the index lost 0.19% and on a weekly basis, it was up by 1.36%. 

Nasdaq

Nasdaq reacted to the mixed sentiments of investors and was down by 0.36% on Friday. Overall, despite the pullback, investors remain bullish in the short-to-medium. On a week-on-week basis, the index closed higher by 1.49%. 

The European equity market traded lower during the week, despite a major catalyst coming in from the US. Inflation and growth concerns are still hurting the European economy. Also hawkish commentary from ECB officials impacted investors’ sentiment. 

Let’s look, how different economies performed during the week. 

FTSE 100

The Bank of England (BoE) kept its key policy rate at 5.0%, which is on expected lines, as the central bank awaits more appropriate economic indicators to begin the rate-cutting cycle. 

On Friday, FTSE 100 traded lower and was down by 1.2%, wiping out the gains of the entire week. On a week-on-week basis, it was lower by 0.48%.

CAC 40

Utility and services sector stocks drove CAC 40, France’s primary stock market index, lower in Friday’s session, losing 1.54% at the end of the day. Weekly, the index closed flat. 

DAX

Losses in technology, transportation & logistics, pharmaceuticals, and healthcare stocks pulled the market lower on Friday. DAX, Germany’s primary stock market index lost 1.51% in Friday’s session, wiping out some weekly gains. On a week-on-week basis, DAX gave a positive closing of 0.69%. 

With hopes that FIIs will increase investment in emerging Asian economies following the Fed rate cut, most Asian indexes traded higher. Barring China, all other Asian economies traded with a positive bias. 

Let’s now have a look, how the major stock market index performed during the week. 

Nifty 50

The Nifty 50 had a volatile week, but it still managed to reach a new record high on Friday. Year to date, the index has gained nearly 19%.

On Friday, the index closed 1.48% higher, while the Nifty 50 rose 1.55% week on week.

Nikkei 225

The Japanese stock market rose over the week and Nikkei 225 closed the week 2.28% higher. On Friday, it was up by 1.51%. 

During the week, Japan’s central bank held the short-term interest rates steady at around 0.25%, which was widely expected. 

Straits Times

Singapore’s equity market was the top performing index of the week among global peers. Boosted by the Fed’s rate cut, Singapore’s primary stock market index, Straits Times rose 5.33% over the week. But, on Friday’s session the index traded slightly lower by 0.23%. 

Hang Seng

Boosted by the Fed rate cut, The Hong Kong stock market rose showcased a strong performance during the week. On Friday, the Hang Seng index added 1.34% and on a weekly basis, it registered a cumulative gain of 4.59%.

Taiwan Weighted

Following the global cues, Taiwan’s primary stock market index, Taiwan Weighted Index, put up a strong performance during the week. It was up by 0.53% at the close on Friday, and on a week-on-week basis, it was up by 5.06%. 

KOSPI

Tracking gains of the US market, South Korean shares traded higher on Friday. The country’s primary stock market index- KOSPI was up 0.48% higher, helping the index to wipe out the weekly loss. At the close of the week, it was up by 0.49%. 

SET Composite

Thai stocks traded flat in Friday’s session, and closed the day slightly lower by 0.22%. However, on a week-on-week basis, the index rose 6.31%, helping it to continue the strong bullish momentum for another week.

Jakarta Composite

Indonesian stock market index, Jakarta Composite traded lower on Friday, and was down by 2.1%. On a week-on-week basis, the index rose 0.91%

Shanghai Composite

Economic stress continued to impact the Chinese equity market during the week. August data highlighted China’s slowing economy. Industrial production increased 4.5% year on year, which was below expectations and falling short of July’s 5.1% increase due to lower commodity prices and auto sales. Retail sales rose by a less-than-expected 2.1% from a year ago, slowing from July’s 2.7% increase.

On Friday, Shanghai Composite traded flat and closed the week lower by 1.70%. 

Wrapping Up

The global stock market traded with a positive bias, but traders remain skeptical of the Fed’s larger-than-usual rate cut and are trying to figure out what it means. Looking ahead, we can expect some short-term market volatility. However, closely monitoring key economic data, central bank commentary, and global developments will provide valuable insight into near-term market direction. 

Following an initial knee-jerk reaction in the market due to rising recessionary fears in the world’s largest economy, the market gained some ground the following week. 

Both the US and European stock markets are trading with a positive bias, fueled by rising hopes of a Fed rate cut and tech stock gains. 

On Monday, the Eurozone released its trade statistics. The trade surplus decreased slightly from €21.7 billion in June to €21.2 billion in July. Compared to July 2023, exports increased 10.2% yearly, while imports increased 4.0%. While the trade surplus fell slightly in July, it was significantly higher than in July 2023, indicating a stronger demand environment.

The European Central Bank moved ahead with a second rate cut for 2024, slashing borrowing rates by 25 bps to 3.65%. The move comes amid rising inflation and slower growth projections. 

In the US, retail sales data released on Tuesday showed that inched higher by 0.1% in August, against the expectation of a 0.2% decrease. This is likely to give the market much-needed ammunition to keep its momentum strong. 

Top Gainers and Losers in the European Stock Market

Top Gainers

The following are the top gainers in the last one week. 

Source: Tradingview

Top Losers

The following are the top losers in the last one week across various sectors:

Source: TradingView

In the last week, Producer Manufacturing, Electronic Technology, Technology Services, Transportation, Communications, Retail Trade, and Non-Energy stocks supported the market higher, while consumer non-durables and health Technology pulled the index lower.

Let us also see how the indices fared during the week

STOXX Europe 600

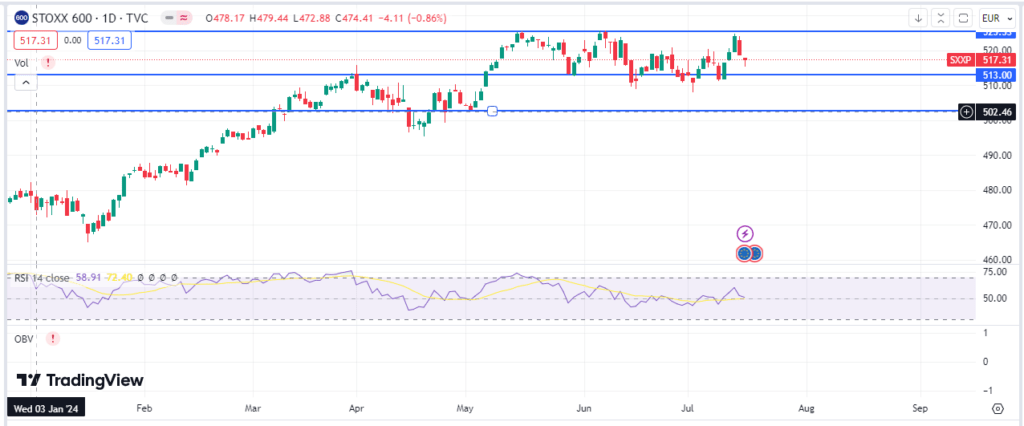
As global markets remain upbeat, Europe’s largest stock market index, STOXX Europe 600 index, continued to move higher to record its highest closing level in two weeks. In the last 5 trading days, the index has moved higher by 1.75%. 

AD 4nXcfqOE85zrTlS KBKXcU0aVBLpEJOzjcJ3Gc8ZHXwClKm6WTx0XeFdEPhW4E4BiuMGQXnzo6 DRnGqcm0W7lm5XtnM4KOMdXmtPwdVizt7sf7NUuhvJYjEGKARx N5MJnJHD0apU9TXXALoPCSmVEvMFsLB?key=bof40DxTN6dcNfg jPM ww
Source: TradingView

The index is gaining momentum and has broken above the 20-day EMA slope, implying that the short-term trend remains positive. Currently, the index is facing strong resistance at around 520, and failure to break above this level could result in a sell-off or the index trading range-bound. If it breaks above 520, the next major resistance level is 525. 

FTSE 100

Economic headwinds in terms of stagnating growth due to contraction in manufacturing activity leading to mixed sentiments among investors. 
Following the global cues, the UK’s primary stock exchange, FTSE 100, traded with a positive bias, and in the last five trading sessions, the index has inched higher by 1.27%. 

AD 4nXcs7ni8HSEf7ZhnsXckq9PL3Cvvc8CZAjFK1b1lsaNDERiWUJOY6Ze0NI777cjmwdiyoOGJEOImqPjwfnJI4pRmEUk AUOR21KoeN36P8vOCkH279VZKAJlMYEKnTR6lYTetLfuk6nK64wfMMDlcCO54CQ?key=bof40DxTN6dcNfg jPM ww
Source: TradingView

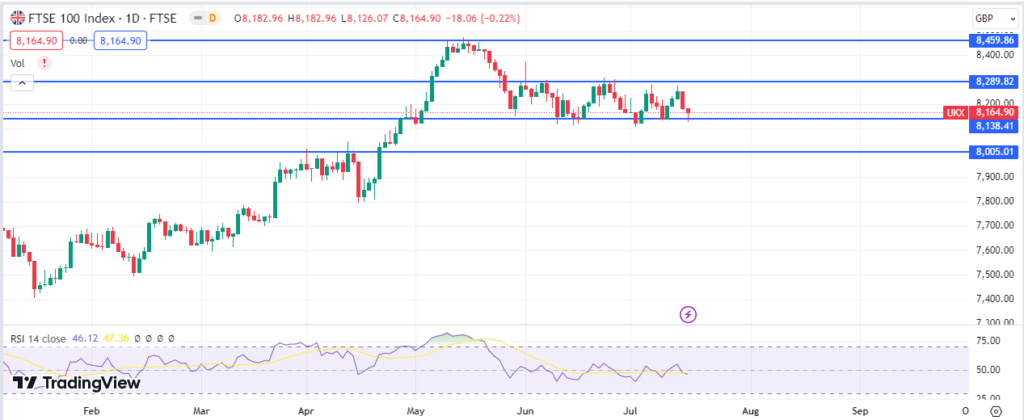
On the daily chart, we can see that the index is trading between 8,300 and 8,200. The index is likely to look for a strong or clear trigger to gain momentum and break higher. If the index moves past the 8,360 level with strong momentum, it may approach the 8,500 level. However, momentum is the key, as weak momentum can lead to a sell-off in the market and a break-up below the 8,140 level. 

CAC 40

The overall momentum in the index has shifted bearish as traders become more cautious about the French economy following the Olympics, most likely due to political uncertainty, flat earnings, and luxury sector concerns.

The CAC 40 has gained slowly compared to its European counterpart, rising 0.92% in the last five trading sessions. 

AD 4nXe6USbQw07GIefjWsKPunonu5hjxKX5jWPmtD8VFD20KJe68aNYB hk4JeDzV ZUXvcxppFuZn0n0JgJ1DQryxIE7DjBIEAjiigKLROmd1Cskljqaqwh pIR7bcblQZZODVUULKIsnOZW SzC3oFfShmMRN?key=bof40DxTN6dcNfg jPM ww
Source: TradingView

Looking at the daily chart, the level around 7,500 has become extremely resistive, and the index lacks the momentum to break above it. If it fails to move above the 7,500 level, we might see the index testing the levels around 7,300 for support. 

DAX

Overall, sentiment in the German economy remains strong. Stocks rose after the close on Tuesday, driven by gains in the retail, technology, and chemical sectors.

Also, better than expected retail sales data in the US will likely push the index higher. Following the global cues, the German index DAX has been up 2.09% in the last five trading days. 

AD 4nXcbRuJ TLw3GJ02pnF3niqr9k rp7W GponuuGHcc0iLn6mdNQLrZ9W96QCXNUyLIQ4LvlS1TU3PazzqUgKOf9RRTQrSSMP3SVYpQY3V4AJTHT08XWxvtHY fSsxTOrexOKoD Z x6nbUS0FDEdpoduG zB?key=bof40DxTN6dcNfg jPM ww
Source: TradingView

The overall momentum of the market is strong, and it has broken above the 20-day EMA slope with strength. If the index continues to move higher and break above the much resistive 18,750 level, we may see it go past the 19,000 level. 

 Conversely, the index has strong support around the 18,500 level. 

Conclusion 

As we move forward, European stocks are likely to follow global cues. Closely tracking the US central bank’s rate cuts and its commentary on future rate cuts will help you determine the market’s near-term momentum. Keeping a close eye on all market developments is critical for making sound investment decisions in these rapidly changing market conditions. 

The global market staged a strong recovery after the previous week’s sell-off while the markets prepared for the first rate cut by the Fed. The increased probability of a 50 bps rate cut also drove the market higher this week.

In the European market, weakening economic growth prompted the European Central Bank to go for another rate cut this week, resulting in the market to trade higher during the week. 

Crude oil has gained some ground during the week, but overall momentum continues to be bearish. Brent Crude is currently trading slightly above the $70 level. 

On the other hand, Gold continued its ascent reaching a new record high level. In the last one week, it has gained close to 2.5%. 

Let’s take a look at how the major stock market indices did this week.

IndexPrevious Day Change (%)WoW Change (%)
US Markets
Dow Jones0.722.60
S&P 5000.544.02
Nasdaq0.655.95
European Markets
FTSE 1000.390.04
CAC 400.40-0.48
DAX0.970.58
Asian Markets
Nifty 50 -0.132.44
Nikkei 225-0.69-1.26
Straits Times0.173.52
Hang Seng0.74-0.51
Taiwan Weighted0.493.16
KOSPI0.13-0.21
SET Composite0.204.31
Jakarta Composite0.181.81
Shanghai Composite-0.48-2.88

Strong performance in the growth and technology stocks have lifted the market higher this week. The market is now awaiting a decision on the quantum of rate cut by the Fed. 

Speaking about economic indicators, the core inflation in August slightly rose to 0.3%, a tick higher than expectations. Meanwhile, the headline inflation has slowed down to 2.5% from 2.9% in July. It is the lowest level since early 2021. 

Let’s check how the top US indices performed during the week. 

Dow Jones

Ahead of the Fed meeting, the index traded with a positive bias. On Friday, Dow Jones was up by 0.72%, and on a week-on-week basis, the index posted a cumulative gain of 2.60%. Boeing was the biggest loser in the index and was down by 3.69% on Friday. 

S&P 500

The 500 stocks index gained ground on improved consumer sentiment and positive investors bias. On Friday, the index was up by 0.54%, taking the weekly gain to 4.02%. 

Nasdaq

Investors bought the dip in the market, and traded higher during the week. Nvidia, which was the top loser of the index last week, is up by around 13.5% this week. On Friday, Nasdaq climbed 0.65% and on a weekly basis, the index was up by 5.95%. 

The European Central Bank lowered interest rate for the second time this year, reducing it by 0.25% to 3.5%, which was in expected lines. Some economic indicators are signalling contraction in the Eurozone economy, and the ECB is likely to stay cautious and may look to lower borrowing costs in next few quarters

Now, let’s look at how the top three European indexes performed during the week.

FTSE 100

As growth paced slowed down for the second consecutive month in July, led by contraction in manufacturing activity leading to mixed investors sentiment. 

On Friday, FTSE 100 traded slightly higher by 0.39%, helping to close the week with no gain and loss. 

CAC 40

The CAC 40, France’s primary stock market index, closed in the green on Friday due to monetary easing. It increased by 0.40% but failed to finish the week in the green. On a weekly basis, the index fell by 0.48 percent. 

DAX

Gains in the retail, chemical, and technology sectors pulled the index higher. DAX was up by 0.92% on Friday, helping the index to post gains on a weekly basis. The index closed the week higher by 0.58%.

The Asian equity markets largely followed global trends as investors began to closely monitor developments related to rate cuts, which will provide short-term direction to the market. Domestic factors also played an important role. 

Let’s now have a look, how the major stock market index performed during the week. 

Nifty 50

Nifty 50 traded range bound during the week, but traded with a positive bias. On Friday, the market was volatile, but closed flat with a slight loss of 0.13%. On a week-on-week basis, the index was up by 2.44%. 

Nikkei 225

The Japanese stock market traded on a mixed note over the week as hawkish commentary from the Bank of Japan kept the market busy. On the economic front, the second quarter GDP number was revised lower, hurting investors sentiment.

Nikkei 225, the primary stock market index of Japan, traded lower on Friday and was down by 0.69%. On a week-on-week basis, it was down by 1.26%. 

Straits Times

Singapore’s equity market traded on a flat note this week. On Friday, the index was slightly up by 0.17% and on a weekly basis, it was up by 3.52%.

Hang Seng

The Hong Kong stock market rose on Friday on speculation of borrowing rate cuts in China. The Hang Seng index added 0.74% on Friday. But, on a weekly basis, it was down by 0.51%.

Taiwan Weighted

Strength in the semiconductor and electronic sectors helped the Taiwanese market to trade with a positive bias. Its primary stock market index, Taiwan Weighted Index, was up by 0.49% at the close on Friday, and on a week-on-week basis, it was up by 3.16%. 

KOSPI

After two weeks of consecutive sell off in the Korean market, the momentum of the market was sideways. On Friday, KOSPI was up by 0.13%, but on a week-on-week basis, the index was slightly down by 0.21%. 

SET Composite

For another week, Thailand’s equity market traded with a bullish momentum. SET Composite rose 0.20% on Friday, bringing its total gains for the week to 4.31%. 

Jakarta Composite

Indonesian stock market index, Jakarta Composite traded with a positive bias during the week. It was slightly up by 0.18% on Friday and on a week-on-week basis, it was up by 1.81%.

Shanghai Composite

Chinese stocks fell on weak inflation data, raising concerns about a downward price-wage spiral weighing on the economy. Deflationary concerns and failure to spur the economy is keeping Chinese equity under pressure. On Friday, Shanghai Composite was down by 0.48%, and on a week-on-week basis, the index lost 2.88% value. 

Wrapping Up

The global market has recovered some ground following the previous week’s sell-off. However, investors remain cautious about the rate cuts. Looking ahead, we can expect some short-term volatility in the market. However, closely following key economic data and global development will provide insight into near-term market direction. Staying informed and cautious may be necessary as the markets adjust to these ongoing shifts.

Fewer job openings and concerns of an economic slowdown battered the US stock market last week, resulting in the S&P 500’s worst weekly drop in 18 months. The Fed’s lack of clear timelines regarding rate cuts also affected investors’ sentiment. 

The oil market is currently experiencing a strong sell-off. Brent Crude is trading below $70, nearing a three-year low due to weak oil demand. However, there were a few gainers and losers in the market.

Top Gainers and Losers in the US Stock Market

Top Gainers

The following are the top gainers in the last one week. 

StocksLast 7 Days Gains (in %)
Oracle10.99
American Tower Corporation8.97
Tesla5.07
Verizon Corporation4.03
Mondelez International4.44
Source:Tradingview

Top Losers

The following are the top losers in the last one week across various sectors

StocksLast 7 Days Loss (in %)
ASML15.82
KLA Corporation11.44
Google8.08
Conocophillips7.06
Nvidia6.06
Source: TradingView

In the last week, weakness in the market was led by Electronic Technology, Technology Services, Producer Manufacturing, Energy Minerals, and Consumer Services. While Retail Trade, Consumer non-durables, Commercial Services, Utilities, and Health Technology. 

Due to falling crude oil prices, the S & P 500 Energy Index has dropped 4.57% in the last five trading sessions. 

Let’s check out how the major US stock market indexes stand out during the week. 

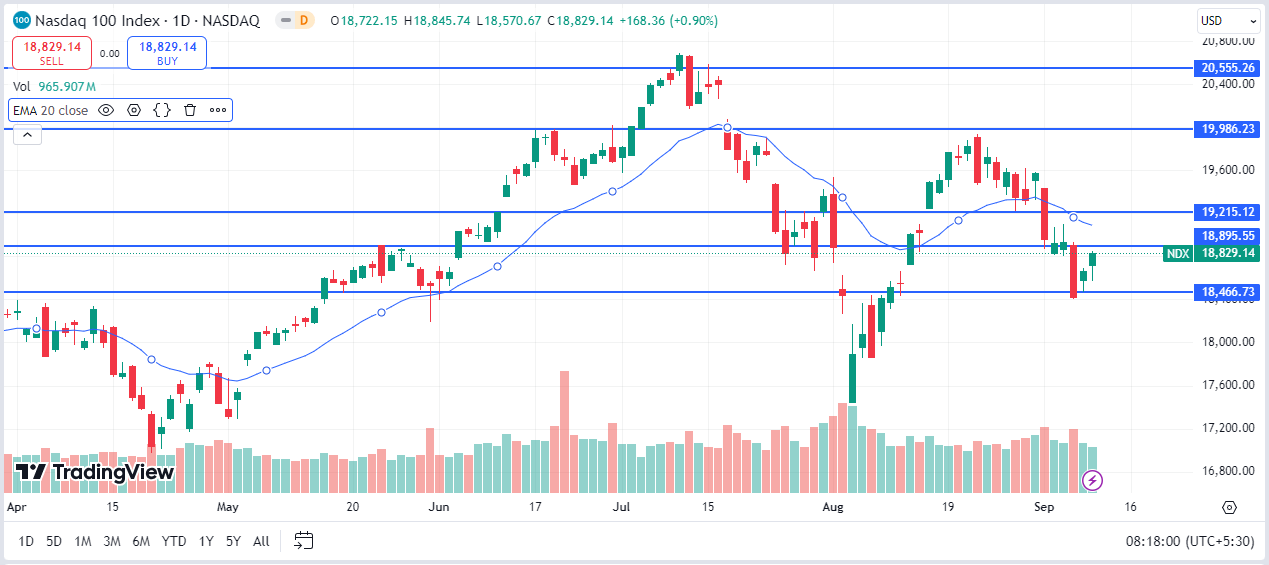
Nasdaq 100

After last week’s sell-off, Nasdaq gained ground as the rebound continued. Broadcom, the key hardware supplier for iPhone 16, has gained upside momentum and is up by more than 5% in the last 24 hours. 

Nvidia, a semiconductor chip manufacturer, is trading with a positive bias this week after falling nearly 14% the previous week. 

On Tuesday (September 10, 2024), the Nasdaq 100 continued to trade with a positive bias and slowly gained momentum. At the end of the day, it gained nearly 1%. 

s1 1
Source: Tradingview

S&P 500

S&P 500 stocks gained ground as traders and investors reacted to a strong sell-off in the oil markets. Lower energy prices may provide additional support to many struggling industries and boost the labor market. 

On Tuesday (September 10, 2024), the S&P 500 gained 0.45%, trying to go past the psychologically important 5,500 level. If the index manages to break above the 20 EMA slope, we may see additional buying in the market, which can propel the index toward its all-time high.

s2 1
Source: Tradingview

Conclusion

In the short term, markets will likely remain volatile, and future directions will depend on the Consumer Price Index and Producer Price Index reports. A lower-than-expected inflation number can boost growth sectors like technology and consumer discretionary, as lower inflation reinforces expectations of more than one Fed rate cut. However, if inflation exceeds expectations, the market may fall as chances of rate cuts diminish, and more aggressive monetary tightening may resurface.

The global market experienced a significant sell-off this week due to slowdown concerns and a bearish short-term outlook, which influenced investor sentiment. The US market fell the most in one week in 18 months. Meanwhile, the European market responded to the deteriorating global economic growth outlook. Furthermore, the weak corporate earnings reports and economic data from the world’s second largest economy are dragging down the global market.

Brent Crude has fallen to its lowest level in 14 months due to concerns about demand in the United States and China. It is currently trading near $70 and has dropped by nearly 7% in the past week. Gold continues to trade with a sideways bias.

Let’s take a look at how the major stock market indices did this week.

IndexPrevious Day Change (%)WoW Change (%)
US Markets
Dow Jones-1.01-2.93
S&P 500-1.73-4.25
Nasdaq-2.55-5.77
European Markets
FTSE 100-0.74-2.33
CAC 40-1.08-3.65
DAX-1.50-3.20
Asian Markets
Nifty 50 -1.17-1.79
Nikkei 225-0.73-5.84
Straits Times-0.120.34
Hang Seng-0.07-.2.34
Taiwan Weighted1.15-3.74
KOSPI-1.23-4.86
SET Composite1.645.05
Jakarta Composite0.530.67
Shanghai Composite-0.81-2.69

Negative events in the economy resulted in the US stock market entering a bearish state. Weak labor market, rout in tech stocks, and job cuts all affected the market. 

The country added 142,000 jobs in August, against expectations of 160,000 jobs. Also, July’s gain was revised down, which further complicated the economic growth revival picture. 

Let’s check how the top US indices performed during the week. 

Dow Jones

Amidst the broader pullback in the market, Dow Jones dropped by 1.01% on Friday, and for the entire week, the index reported a cumulative loss of 2.93%. 

S&P 500

S&P 500 retracted the most on the weekly basis in 18 months as fears of recession rising among investors. The index dropped by 1.73% on Friday, taking the weekly loss to 4.25%. 
Nasdaq

Sell of tech stocks and growth worries made the situation worse for Nasdaq. Nvidia, one of the most valuable tech companies in the world, has dropped by close to 14% in the last five trading sessions. On Friday, the index closed 2.55% lower and on a week-on-week basis, it dropped by 5.77%. 

Echoing the US market sentiments, European markets also traded with a bearish note during the week. Concerns of disinflation and structurally sluggish economic growth also give investors some worries.

Now, let’s look at how the top three European indexes performed during the week.

FTSE 100

Compared to European peers, and the US market, the UK stock market index, FTSE 100, fell significantly lower. On Friday, the index was down by 0.74% and on a week-on-week basis, it was down by 2.33%. 

CAC 40

Mixed economic data, and fears of slowdown in US economic growth soured investor sentiment. Paris bourse CAC 40 was down by 1.08% on Friday, taking the weekly cumulative loss to 3.65%. 

DAX

In July, German manufacturing orders increased by an unexpected 2.9%. However, industrial production in Germany fell much more than expected, by 2.4% sequentially, after rising 1.7% the previous month.

During the week, Germany’s primary stock market index, DAX, registered a total loss of 3.2%. In Friday’s session, it was down by 1.50%. 

Global factors combined with back to back weak economic indicators from world’s second largest economy resulted in the market to trade with a negative bias, with few exceptions around. 

Let’s now have a look, how the major stock market index performed during the week. 

Nifty 50

Historically, a weak month, the Indian market continued to be under corrective pressure. During the week, Nifty 50 went past 25,000 level, hitting a new all time high level. But, failed to maintain the positive momentum. On Friday, Nifty 50 was down by 1.17%, and on a week-on-week basis, it was down by nearly 1.8%. 

Nikkei 225

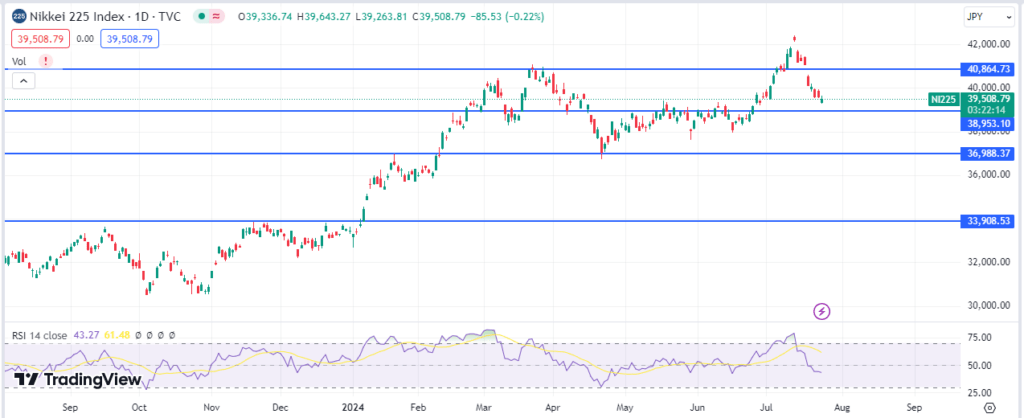
Weakness in semiconducor stocks and yen strength posing a challenge for Japan’s export-oriented companies kept the market under pressure. On Friday, Nikkei 225 was down by 0.73% and on a weekly basis, the total losses for the index was nearly 6%. 

Straits Times

Bucking the trend, Singapore’s equity market traded on a flat note this week. On Friday, the index was slightly down by 0.12% and on a weekly basis, it was up by 0.34%.

Hang Seng

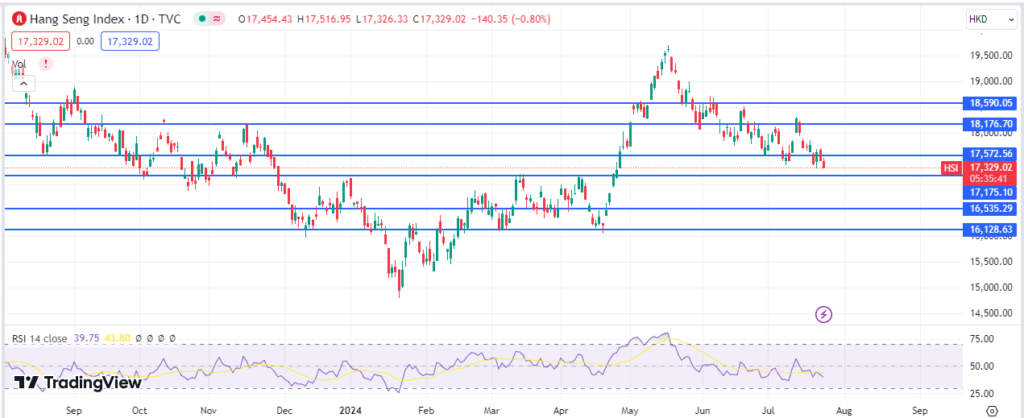
The Hang Seng index was flat on Friday’s session and was slightly down by 0.07%. And, on a week-on-week basis, the index reported weekly cumulative loss of 2.34%. 

Taiwan Weighted

Taiwanese stocks were higher at the close of trade on Friday. Its primary stock market index, Taiwan Weighted Index, was up by 1.15% at the close on Friday, but on a week-on-week basis, it was down by 3.74%. 

KOSPI

The South Korean equity market index witnessed a second weekly loss due to the tech sell off. On Friday, the index was down by 1.23%, and for the total week, the losses increased to 4.86%. 

SET Composite

Thailand’s equity market stood out among global indices. The index rose 1.64% on Friday, bringing its total gains for the week to 5.05%. 

Jakarta Composite

Indonesian stock market index, Jakarta Composite traded mostly sideways during the week. It was up slightly by 0.53% on Friday and on a week-on-week basis, it was up by 0.67%.

Shanghai Composite

Weak housing sales data and weak corporate earnings reports, resulted in lowering buying sentiment among investors. During the week, Shanghai Composite fell by 2.69% and on Friday, it was down by 0.81%. 
Wrapping Up

In the face of a turbulent global market, the outlook remains uncertain as economic concerns weigh heavily on investor sentiment. While short-term volatility has affected major indices, long-term prospects will depend on how economies address these challenges. As we move forward, closely watching key economic data, corporate earnings, and global developments to navigate the current market landscape will be important. Staying informed and cautious could be essential as the markets adjust to these ongoing shifts.

Major global indices ended the week on a mixed note, as investors awaited additional data to interpret the market’s state and determine its future direction following the previous week’s strong rally. 

The reassuring growth and inflation data from the United States and Europe are comforting investors and raising expectations for future rate cuts. 

Crude Oil continued to experience pressure and traded below the psychologically important $80 level. Gold, on the other hand, continued its bullish momentum, climbing close to 5% during the week as investors weighed on the risk sentiment.  

Let’s look at how the major stock market indices did this week.

IndexPrevious Day Change (%)WoW Change (%)
US Markets
Dow Jones0.550.94
S&P 5001.010.24
Nasdaq1.13-0.92
European Markets
FTSE 100-0.040.59
CAC 40-0.130.71
DAX-0.031.47
Asian Markets
Nifty 50 0.331.28
Nikkei 2251.252.23
Straits Times1.121.62
Hang Seng1.132.14
Taiwan Weighted0.300.50
KOSPI0.45-1.01
SET Composite0.120.31
Jakarta Composite0.561.68
Shanghai Composite0.67-0.43

The week brought some relief and hopeful signs for the US market, with rising personal income and spending in July raising hopes for stronger-than-expected economic growth in the third quarter. 

The Commerce Department revised its annualized GDP estimates in the second quarter to 3% from 2.8%. Better economic indicators and cooling down inflation raised rate-cut hopes. 

Let’s check how the top US indices performed during the week. 

Dow Jones

Dow Jones traded flat this week despite a strong rally in one of its major components, Intel, which rose by nearly 9%. On Friday, the index rose 0.55%, and week on week, it increased by 0.94%.

S&P 500

The higher spending and consumption report on Thursday helped the S&P 500 index gain ground on Friday, and it is now trading near all-time highs. The index rose by 1.01%, with a 0.24% increase week over week. 

Nasdaq

The NASDAQ gained ground as demand for technology stocks increased. The index rose 1.13% on Friday but failed to close the week on a positive note. It fell by 0.92% week on week. 

Eurozone inflation is near its target. The eurozone’s headline annual inflation rate fell to 2.2% in August from 2.6% in July, the lowest level in three years but slightly above the ECB’s 2% target. But, policymakers are still cautious about lower interest rates.

Also, the eurozone’s economic sentiment indicator improved to 96.6 in August from 96 the previous month.

Let’s look at how the top three European indexes performed during the week.

FTSE 100

The UK’s economy continued its strong momentum, which was also reflected in its stock market. FTSE 100, the primary stock market index of the UK, traded on a flat note and was slightly down by 0.04. On a week-on-week basis, it was up by 0.59%. 

CAC 40

The S&P Global-compiled HCOB flash purchasing managers index for France’s services sector rose to a 27-month high of 55.0 in August, up from 50.1 in July and far exceeding expectations. The CAC 40, France’s primary stock market index, was down 0.13% on Friday, but it rose 0.71% for the week.

DAX

The contraction in second-quarter GDP has reignited investors’ recessionary fears. However, strength in the broader market led to strength in the German stock market index. On Friday, the DAX traded flat but was up 1.47% week on week.

This week, Asia’s major stock market indices traded with a positive bias following global cues. Additionally, domestic factors pushed the market higher.

Now, look at how the major stock market index performed during the week. 

Nifty 50

Strong momentum in the Indian market propelled the Nifty 50 to a new record high. On Friday, the Nifty 50 traded 0.33% higher, with the index closing 1.28% higher on a weekly basis.

Nikkei 225

Gains in Manufacturing and automobile stocks pushed Japan equities higher and added 1.25% to the Nasdaq index on Friday. On a weekly basis, the index closed 2.23% higher. 

Straits Times

Tracking broader market cues, Singapore’s equity market rose during the week. It was up 1.12% on Friday, and on a weekly basis, it was up 1.62%.

Hang Seng

The Hang Seng index rallied during the week on rising hopes of a US soft landing. On Friday, it was up by 1.13%, and on a week-on-week basis, it was up by 2.14%. 

Taiwan Weighted

Taiwanese stocks were higher at the close of trade on Friday. The Taiwan Weighted Index, the country’s primary stock market index, was slightly up by 0.30% at the close on Friday, and on a week-on-week basis, it was up by 0.50%. 

KOSPI

The South Korean equity market witnessed a mixed week, with a sell-off in tech stocks. Its primary stock market index, KOSPI, was up by 0.45% on Friday but ended the week lower by 1.01%. 

SET Composite

Thailand’s equity market witnessed less dramatic price changes during the week. The SET Composite was slightly up by 0.12% on Friday, and the index’s total gain was 0.31% on a week-on-week basis.

Jakarta Composite

The Indonesian stock market index, Jakarta Composite, traded mostly like its global peers. It was up by 0.56% on Friday and by 1.68% week-on-week.

Shanghai Composite

Chinese stocks fell after a series of corporate earnings reports missed expectations, lowering buying sentiment. While the Shanghai Composite was up by 0.67% on Friday, it ended the week down by 0.43%. 

Wrapping Up

As we look ahead, the global market conditions are mixed but cautiously optimistic following better-than-expected economic data this week. The contrasting performance of crude oil and gold indicates that investors balance optimism and caution. However, investors should remain watchful as the market may shift due to new economic data, policy decisions, or unexpected global events.

Reducing recessionary fears in the United States and positive commentary from central banks worldwide are boosting global markets, including Europe. Following initial jerks in August, European markets have returned to positive territory over the last month. 

The Paris Olympics boosted Eurozone economic activity in August after stalling in July. According to S&P Global’s purchasing manager index (PMI), the services sector output rose to a four-month high of 51.2 from 50.2. Meanwhile, manufacturing production continued to contract for the 17th month because of weak foreign demand. 

Also, the probability of the ECB cutting interest rates in September has strengthened as inflation continues to decline. Germany, regarded as the engine of the EU, recorded a GDP contraction in the second quarter of 2024, shrinking by -0.1% quarter-on-quarter from +0.2% from January to March. 

Top Gainers and Losers in the European Stock Market

Top Gainers

The following are the top gainers in the last one week. 

StocksLast 7 Days Gains (in %)
Delivery Hero SE11.15
BASF SE NA O.N.4.82
Vonovia SE4.77
Ferrari4.41
Universal Music Group4.32
Source: Tradingview

Top Losers

The following are the top losers in the last one week across various sectors:

StocksLast 7 Days Loss (in %)
ASML6.02
AEGON5.91
Salmar ASA5.41
Maersk4.33
BE Semiconductor Industries4.18
Source: TradingView

There was no clear trend in the market, which sector contributed to the market’s positive momentum. Essentially, Finance stocks led the gains in the market, followed by health technology, Consumer Durables, and Utilities. While Electronic Technology, Energy Minerals, and Technology Services stocks were mainly down.

Let’s check how the top European Indices performed. 

STOXX Europe 600

Europe’s largest stock market index, the STOXX Europe 600 index, representing almost 90% of the European market, traded positively over the week. As of 28 August, the index has traded higher by 1.26% over the last five days and is up by 1.39% over the month. 

AD 4nXe JRkT53ohP55W8X3Fgivdn4Oy3jdn8gQFSyTUKFqzIn6h7SXnbeeGdnSGyAtnZUd54AzHTyb5btsRAb JbNxi2zDlv6wJObZUwxC5DunAa9dpCnet5DaAsFhYkeXqKoBTWAJ3jd1hEEFs8xXLowzbq53l?key=bof40DxTN6dcNfg jPM ww
Source: TradingView

The index reversed all the losses it recorded in the first week because of the Yen Carry Trade sell-off. STOXX Europe 600 is currently experiencing resistance at around 520, but the upside momentum continues to be strong. A break above 525 would be highly positive for the index. 

FTSE 100

UK Purchasing managers’ data for August showed that private sector output continued to grow steadily, aided by stronger new orders. The S&P Global Composite Purchasing Managers’ Index for August was 53.4, up from 52.8 in July, the highest since April.

AD 4nXdMpp5e14pjkaCO2QtEMPhmW4lusjXy0jQosn4mvA1nE5ABM2d3 azypfNG Zv aWPoAXGJW2s UJtfMQ2Ul yz5MCvaPl nmkAJBNyw4zGRwg4BbM5vXvcpli5NbMmgH7925lNX5NmxKlZRzjlKjGa2 r?key=bof40DxTN6dcNfg jPM ww
Source: TradingView

As of 28 August 2024, the FTSE 100 is trading with a positive bias. It has been slightly down by 0.14% in the last five days. 

The index is trading range-bound and experiencing strong resistance at around 8,350. Failure to break above this level may lower the market; however, the 50-day Moving Average slope will likely provide strong support. The index must break above the 8,450 level with strong momentum to continue moving higher. 

CAC 40

The S&P Global-compiled HCOB flash purchasing managers index for France’s services sector rose to a 27-month high of 55.0 in August, up from 50.1 in July and far exceeding expectations. As of 28 August 2024, CAC 40, France’s primary stock market index, has increased by 1.05% over the last five days.

AD 4nXeUkrijoFrQqrpDxFT yUN 9O1CC20PzacTEP0YMdpnp 479RTtXCINPuJ LrgZkS9tuwh580D3FJFov7ksh6tUO8cvbZpfHfiGSB0cnpVj1SOEQu2KbJIAdgkR8p4OI8C377SLy8Vgj iOC j7RlgB5QQ?key=bof40DxTN6dcNfg jPM ww
Source: TradingView

Looking at the daily chart, CAC 40 has broken above the psychologically important 50-day moving average slope, indicating bullish momentum in the short term. The 7,730 level above is the index’s next major zone. 

DAX

The contraction in the second quarter GDP number has again raised recessionary fears driven by reduced household consumption and investment. Exports of goods and services fell 0.2% from the first quarter of 2024, reflecting lower global demand and supply chain disruptions.

Following the global cues, the German index DAX has been up by 1.76% in the last five trading days. 

AD 4nXdYvZVABFhMWlUL0DHuFMzqRZ9ofrqud0Q ySD9V9t7pv2ePw8u6MMT8uqNxiPs qTXI 3nrXbCpGkjyk OBgGE9P8qrIq6QpiHdpuUSnWhuvtiS5ZiP2dIiisD3KE7uHYNzP0FpW71FogyL30IJ M4rYG?key=bof40DxTN6dcNfg jPM ww
Source: TradingView

The market’s overall momentum is strong. It is trading close to one of its major resistance levels, 18,700. A break above would be highly positive for the market. Conversely, the index is likely to test for support before continuing to increase. 

The global stock market gained ground on Powell’s dovish comment in the annual Jackson Hole economic conference. Fed Chair Jerome Powell categorically indicated that time has come for the Federal Reserve to start adjusting interest rates anytime in the near future, while inflation risk is subsiding. Positive economic signs from the Eurozone area supported the market.

Gold continued its bullish momentum climbing 5.16% due to risk aversion sentiment. While crude oil continued to trade weak. 

Let’s take a look at how the major stock market indices did this week.

IndexPrevious Day Change (%)WoW Change (%)
US Markets
Dow Jones1.141.27
S&P 5001.151.45
Nasdaq1.471.40
European Markets
FTSE 1000.480.20
CAC 400.701.71
DAX0.751.70
Asian Markets
Nifty 50 0.040.97
Nikkei 2250.400.79
Straits Times0.431.05
Hang Seng-0.161.04
Taiwan Weighted0.04-0.86
KOSPI-0.220.17
SET Composite1.023.98
Jakarta Composite0.741.51
Shanghai Composite0.20-0.87

Signals of easing monetary policy boosted the stock market indices towards new high levels driven by tech sector gains and positive sentiment surrounding the improving economic indicators. Let’s see how the top US indices performed during the week. 
Dow Jones

Dow Jones closed on a high note for the second consecutive week driven by a broad rally in the equity markets. On Friday, Dow Jones was up by 1.14%, taking the weekly gains to 1.27%. 

S&P 500

Dovish Fed Chair comment and strong new home sales report for July sent the 500 stock index higher. On Friday, the index gained 1.15% and on a week-on-week basis, it was up by 1.45%. 

Nasdaq

Tech stocks played a significant role in the market gains on Friday. Tech-heavy Nasdaq traded higher and was up by 1.47% on Friday. On a week-on-week basis, the index gained 1.40%. 

The European market had a solid week of trading because of improving economic indicators, encouraging central bank commentary and improved mood in the US market.

Let’s look at how the top three European indexes performed during the week.

FTSE 100

The UK continued to be the bright spot among major European countries. Its Purchasing Managing Index (PMI) accelerated to 53.4 in August, up from 52.8 in last month, indicating strong growth momentum in the economy. 

FTSE 100 traded with a positive bias during the week and was up by 0.48% on Friday. On a weekly basis, the index concluded the week with gains of 0.20%. 

CAC 40

The French economy benefited from the Olympics in Paris. August saw a notable improvement in services activity, offsetting the continued decline in manufacturing. The S&P Global-compiled HCOB flash PMI increased from 50.1 in July to a 27-month high of 55 in August. 

CAC 40 was up by 0.70% on Friday, and on a weekly basis, it was up by 1.71%. 

DAX

The German economy continues to be weak due to its sluggish recovery and poor international demand for exports, continuing to affect investor sentiment. 

However, strength in the broader market helped to push the German stock market index higher. On Friday, DAX traded higher and closed 0.75% higher and on a week-on-week basis, it gained 1.70% higher.

Supportive economic data and bullish investor sentiment helped the Asian stock market indices to trade with a positive bias during the week. However, domestic factors were also in play limiting the upside compared to the US and UK indices. 

Let’s now have a look, how the major stock market index performed during the week. 

Nifty 50

It was a volatile week for the Indian market, and Nifty 50 traded mostly flat on Friday and was slightly up by 0.04%. On a week on week basis, the index was up by 0.97%. 

Nikkei 225

The Japanese stock market recovered during the course of the week, posting slight gains, after the initial shock at the beginning of the month following the second rate hike. 

On Friday, Nikkei 225 was up by 0.40% and it closed 0.79% higher at the close of the week. 

Straits Times

Following the broader market cues, Singapore’s equity market traded higher during the week. It rose 0.43% on Friday, and on a weekly basis, it was up by 1.05% higher.

Hang Seng

Stocks in Hong Kong stock market traded lower as the light economic calendar and cautious outlook ahead of Fed Chair Powell’s Jackson Hole speech kept buyers on the sidelines. On Friday, Hang Seng fell by 0.16%, but on a week-on-week basis, the index rose 1.04%. 

Taiwan Weighted

Taiwanese stock market index, Taiwan Weighted Index was down 0.86% over the week despite trading with a positive bias on Friday, when it closed marginally higher at 0.04%. 

KOSPI

Profit booking and cautious outlook ahead of the Powell’s Jackson Hole conference kept the market anxious. The South Korean stock market index, KOSPI, was down by 0.22%% on Friday, but closed the week 0.17% higher. 

SET Composite

Bucking the overall trend, Thailand’s equity market index traded on a bullish note during the week. SET Composite was up by 1.02% on Friday, and on a week-on-week basis, the total gain of the index was 3.98%.

Jakarta Composite

Following the global cues, Indonesian stock market index, Jakarta Composite was up by 0.74% on Friday and on a week-on-week basis, it was up by 1.51%.

Shanghai Composite

Persisent slowdown in the economy in the world’s second largest economy continues to impact investor sentiment. Benchmark index Shanghai Composite Index gained 0.2% on Friday, and on a week-on-week basis, it fell by 0.87%. 

Wrapping Up

Looking ahead, the current environment presents both opportunities and challenges. The Fed’s dovish stance and improving economic indicators in the Eurozone suggest potential for continued gains in equity markets. However, risk aversion, reflected in gold’s bullish momentum, and uncertainty in crude oil prices indicate that volatility could persist. Investors should remain cautious, keeping a close watch on central bank policies and global economic trends.

Since the massive crash at the beginning of the month caused by the Yen Carry Trade selloff, the US market has recovered and reversed all of its losses. Federal Reserve Chair Jerome Powell’s positive commentary, an increase in retail sales, and a cooling of inflation supported the market.

Traders are now waiting for Jerome Powell’s comment at the Jackson Hole event on Friday. He is likely to provide the Federal Reserve’s long-term roadmap to support growth. 

Top Gainers and Losers in the US Stock Market

Top Gainers

The following are the top gainers in the last one week. 

StocksLast 7 Days Gains (in %)
Nvidia 13.17
Tesla11.40
Nike11.04
AVGO9.50
Netflix9.39
Source: Tradingview

Top Losers in the US Stock Market

The following are the top losers in the last one week across various sectors:

StocksLast 7 Days Loss (in %)
Valero Energy Corporation5.83
Diamondback Energy4.54
Dominos Pizza4.25
Exxon Mobil3.12
Insulet Corporation3.46
Source: TradingView

Technology Services, Electronic Technology, Retail Trade, Consumer Durables, and Producer Manufacturers supported the market higher last week due to improved investor sentiment. 

On the other hand, energy stocks continue to experience a sharp drop in prices due to increased crude oil prices. In the last week, Brent Crude has been down by nearly 5% and is trading around the $77 level.

How did the US stock market indexes perform during the week?

Nasdaq 100

Stocks in Nasdaq gained ground last week as traders built up their bullish positions on tech stocks. Nvidia and Tesla are leading the charge and were the top gainers in the index last week. 

On Tuesday (20th August 2024), the Nasdaq 100 continued to trade with a positive bias and looked for momentum. It traded flat, with a slight loss of 0.24% at the end of the day. In the last five trading sessions, the index has been up by 3.55%. 

AD 4nXfKx9sA5 btNA0dpUtGxhMkla4nRJ2LNWzGWi11fBf3uNkhf2oPafB
Source: Tradingview

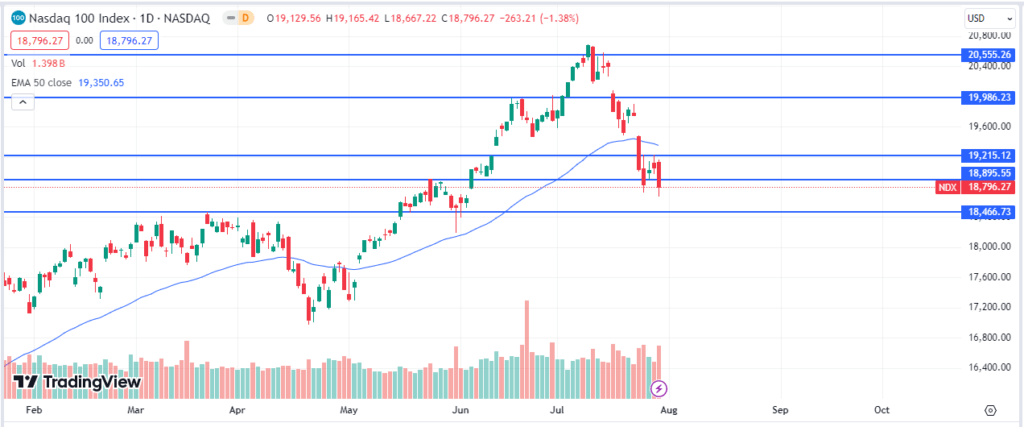
Looking at the daily chart, the index’s overall momentum appears to be positive. The index has broken above the 50-day Moving Average, and the slope is also rising, indicating strong buying. However, the 20,000 level is expected to provide strong resistance. Below, 19,200 and 18,900 are two important support levels. 

S&P 500

Last week, energy stocks were among the worst performers in the SP500 index as traders reacted to the drop in crude oil prices. Healthcare and consumer defensive stocks continue to gain upside momentum, supporting the market’s higher levels. 

On Tuesday (20th August 2024), the S&P 500 ended the day flat and down marginally by 0.20%. The index was up by 2.84% in the last five trading sessions. 

AD 4nXfVyGPh 8zR ggWsCv2EoloGi0VCx0A5BsdIrvlUV52A a4c8dGes4rzH FZV5pgnxnTOfH6 sTOxXjbccaDbAF293eeuSx1VdA4qG3hoG3kodp561QIgtyzqh7 wsLyd4lzpw kHZboad2VcMO2hO0vfqU?key=gvJrmQNycz1Cuf7OZRtEvQ
Source: Tradingview

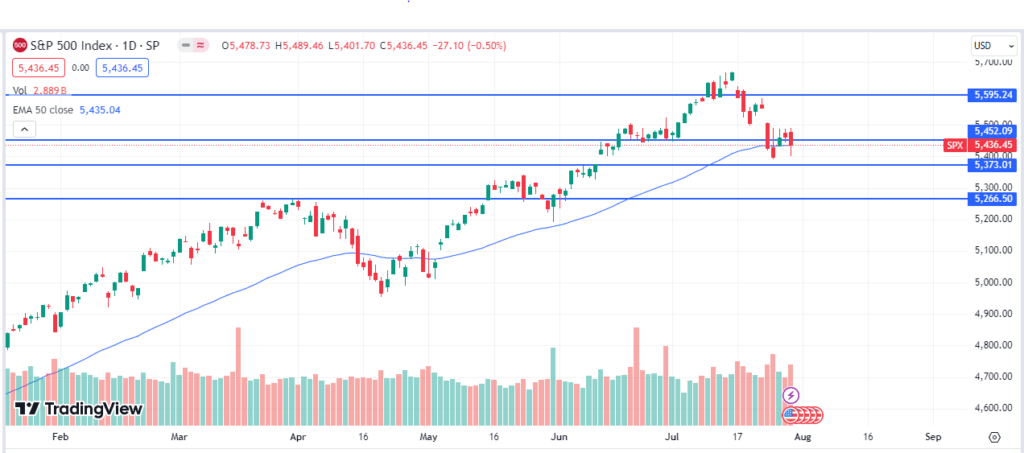
The index maintained positive momentum yesterday and is attempting to stay above the 5600 level, which has turned resistive. It must break above its all-time high of around 5,665 to move higher. The index will find strong support at around the 5,450 level.

Conclusion:

In the coming weeks, the Federal Reserve’s action and commentary on rate hikes, inflation management, and how it intends to spur growth in the world’s largest economy will influence the market’s dynamics. Political uncertainty will also play a role as the presidential election date approaches. To navigate the current market uncertainty, investors should exercise caution by focusing on diversified portfolios and defensive stocks.

The global stock market recovered during the week as fears of recession in the US subsided with positive news on inflation and economic growth. On the other hand, the European market found strength on the back of increasing hopes of rate cuts and improved economic sentiment. The Asian market followed the global cues, with the Nikkei 225 index leading the charge of top gainers. 

Gold climbed 4.68% during the week, reaching a new high level, while crude oil continued to trade weak. 

How the major stock market indices did this week

IndexPrevious Day Change (%)WoW Change (%)
US Markets
Dow Jones0.242.94
S&P 5000.203.93
Nasdaq0.215.29
European Markets
FTSE 100-0.431.75
CAC 400.352.48
DAX0.763.38
Asian Markets
Nifty 50 1.650.62
Nikkei 2253.518.67
Straits Times1.113.63
Hang Seng1.841.99
Taiwan Weighted2.034.10
KOSPI1.954.20
SET Composite1.010.46
Jakarta Composite0.302.41
Shanghai Composite0.070.60

World Stock Market Index: US Markets

US stock market indices rebounded sharply during the week, marking the best week since November 2023. Positive commentary from the Fed on rate hikes and an uptick in retail sales in July helped the market reverse the August 5th sell-off loss. 

Let’s see how the world’s most tracked indexes performed.

Dow Jones

The 30-component index closed the week positively, supported by gains from industrial giants like Boeing, Cisco, and others. On Friday, Dow Jones gained 0.24%, and on a weekly basis, the index was up by 2.94%. 

S&P 500

Improved consumer sentiment in July helped the S&P 500 index gain higher during the week. The market ignored the weak housing sector report, which indicated new housing activity has retreated to early pandemic levels.  On Friday, the S&P 500 index was marginally higher by 0.20%, but it posted strong gains of 3.93% on a week-on-week. 

Nasdaq

The rally in tech stocks led to solid gains in Nasdaq, with Nvidia leading the charge. On Friday, Nvidia posted the best weekly gains of 18%, after posting four consecutive weeks of less. Year-to-date, the stock has gained 149%.  On Friday, the Nasdaq traded flatly, recording a slight gain of 0.21%. On a week-on-week basis, the index gained 5.29%. 

World Stock Market Index: European Markets

Improved sentiment in the US market, dovish central bank commentary, and improving economic indicators helped the European market to trade positively during the week. 

Let’s look at how the top three European indexes performed during the week. 

FTSE 100

In July, headline inflation in the UK rose to 2.2% from 2.0% in June. However, growth in service prices slowed more than expected, which increased hopes for a higher likelihood of interest rate cuts later this year. 

On the other hand, GDP expanded 0.6% sequentially during the April to June quarter, putting the economy on a strong footing. 

On Friday, the FTSE 100 was slightly down by 0.43%. On a weekly basis, the index concluded the week with gains of 1.75%. 

CAC 40

France grew at 0.3% this quarter, the same rate as the previous quarter. Although the country may see an economic boost from the Olympics in the third quarter of this year. On Friday, the country’s primary stock market index, CAC 40, gained 0.35%, taking the total weekly gain to 2.48%. 

DAX

Germany, the eurozone’s largest economy, experienced a surprise contraction of 0.1% in the second quarter of 2024, against the expected 0.5% increase. This compares to a 0.2% increase in the previous first.

However, the market shrugged off the weak GDP growth data, and DAX rose by 0.76% on Friday. On a weekly note, the index gained 3.38%. 

Reversing the trend, Japan led the gains in the Asian market. Better-than-expected economic data from the United States boosted sentiment, easing fears of a recession in the world’s biggest economy.

Let’s look at how the primary stock market index performed during the week. 

Nifty 50

It was a volatile week for the Indian market as major indices sought triggers. On Friday, the Nifty 50 traded on a positive note and gained 1.65%, helping it to wipe the weekly loss and gain 0.62% at the close of the week. 

Nikkei 225

Japan’s second-quarter GDP growth beat expectations by expanding 0.8% from the previous week, thus improving overall market sentiment. On Friday, Nikkei 225 gained 3.51%, taking the total weekly gains to 8.67%. 

Straits Times

Following global cues, Singapore’s primary stock market index traded higher. It rose 1.11% on Friday and fell 3.63% week on week.

Hang Seng

Tracking the gains of the US and European markets, the Hang Seng index gained during the week. On Friday, the index was up by 1.84%, and on a week-on-week basis, it was up by 1.99%.

Taiwan Weighted

Supported by improved sentiment in the US market and a rally in tech stocks, Taiwanese equity traded positively. On Friday, the index traded higher, going up by 2.03%, and on a week-on-week basis, it was up by 4.10%

KOSPI

The South Korean market posted its best week in seven months, as its primary stock market index, KOSPI, rose 1.95% on Friday, taking its weekly gains to 4.20%. 

SET Composite

Thailand’s equity market index, SET Composite, traded higher on Friday by 1.01%, wiping out the weekly loss and closing the week with a total gain of 0.46%.

Jakarta Composite

Jakarta Composite was up by 0.30% on Friday and 2.41% week-on-week.

Shanghai Composite

Mixed economic indicators kept the Chinese market volatile. Industrial production increased by a lower-than-expected 5.1% in July compared to a year earlier, slowing from a 5.3% increase in June, owing to lower auto sales. Retail sales increased by a better-than-expected 2.7% in July compared to a year earlier, up from 2% in June. 

Over the week, Shanghai Composite traded on a bearish note. On Friday, it was slightly up by 0.07%, but on a week-on-week basis, it was up by 0.60%. 

Wrapping Up

With economic sentiment improving across regions, the markets could continue to show resilience. However, with mixed indicators and ongoing uncertainties, investors should remain cautious and closely monitor upcoming data and central bank decisions.

Following last week’s chaos in the market, investor fear has subsided, and the global market is regaining its footing. Lower-than-expected producer price index data in the US has increased hopes for a rate cut by the Fed in September, leading to a surge in stock prices in the US and affecting the Asian market. 

Uneven economic recovery in China, coupled with a lack of consumer spending and lagging industrial activity, continues to be a cause of concern for global growth recovery. This led to foreign investors pulling out a record $15 billion from China in the last quarter. 

Let’s look at how the top Asian indexes performed during the week. 

Nikkie 225

Nikkie 225 recorded last week’s worst fall of the decade, erasing all the gains from this year’s rally. However, the market recovered following positive commentary from the Bank of Japan and a surge in tech and finance stocks. 

In July, Japan’s producer price index increased by 3% yearly, outpacing the 2.9% increase in June. 

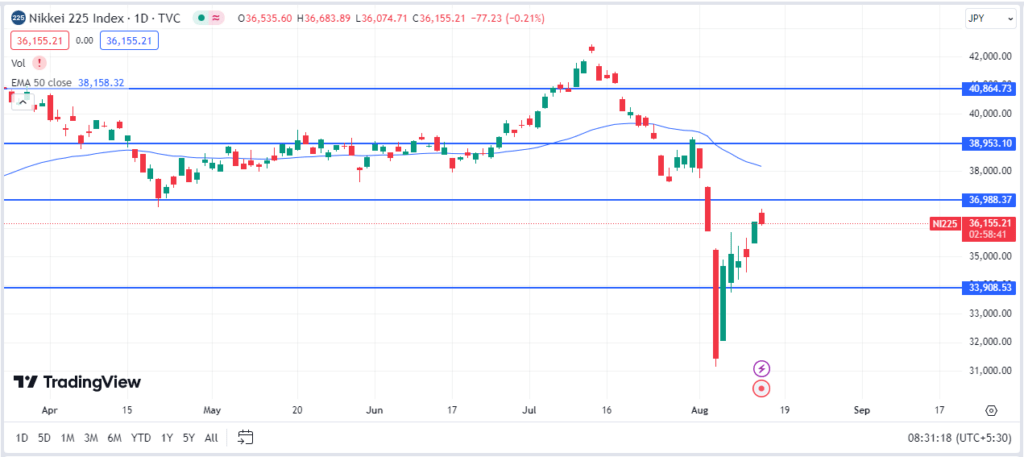
The week starting 12 August 2024, Nikkei 225 traded with a positive bias, as it got support from the improving sentiment of the global market. In the last week, the index has gained nearly 4.3%. But in the previous month, it has been down by 12.4%.

z1
Source: TradingView

Looking at the daily chart of the Nikkei 225 index, we can see that after the massive fall, the index has quickly recovered and is moving towards the next significant resistance at around 37,000. If the current momentum persists, we may see more buying in the market. Below is strong support at the 34,000 level, tested recently, and the index bounced back from there. 

Contributions from all sectors, particularly Finance, Producer Manufacturing, Technology Services, and Electronic Technology, are increasing the market.

Following are the top gainers in the last one week

StocksLast 7 Days Gains (in %)
Mitsubishi Heavy Industries22.57
Recruit Holdings Co Ltd18.38
Sumitomo Mitsui Financial Group18.22
Softbank Group Corp15.70
Mizuho Financial Group14.88
Source: TradingView

Hang Seng

Last week’s China’s inflation numbers fuelled hopes for increased demand. The annual inflation rate increased from 0.2% in June to 0.5% in July. Upward trends in consumer price inflation likely indicated an increase in private consumption and economic activity.

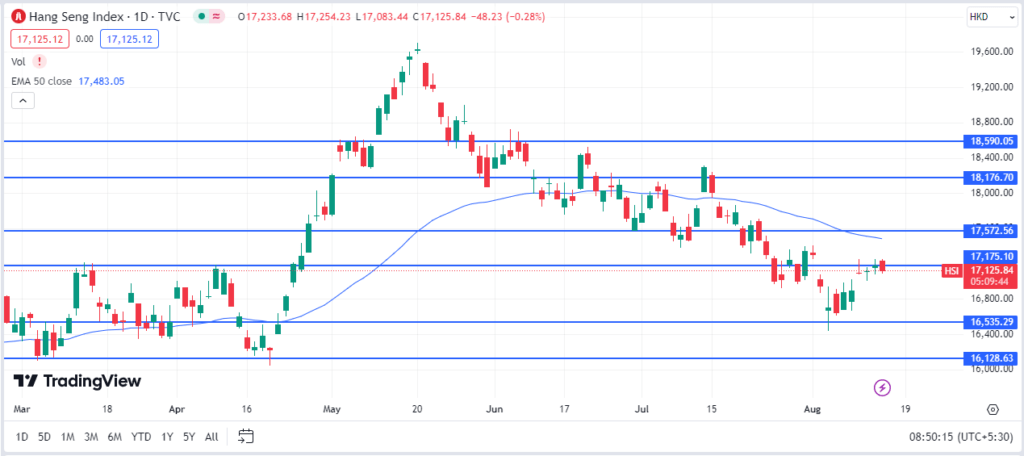
In the last week, Hang Seng has traded with positive momentum and has gained nearly 3%. 

As reported by Bloomberg, The persistent economic slowdown in China has worried investors and increased pessimism, prompting them to withdraw their funds. Foreign investors withdrew a record $15 billion from China in the fourth quarter (April-June 2024), the highest in recent years. 

z2
Source: TradingView

Hang Seng continues to trade on a bearish note. The daily chart shows that the index has bounced higher after testing one of its major support levels at around 16,500. We may see more buying if the index breaks above its next significant resistance at the 17,150 level. 

Finance, Energy Minerals, and Technology Services are the major contributors to this week’s index gain.

The following are the top gainers from the last week. 

StocksLast 7 Days Gains (in %)
Industrial & Commercial
Bk Of China
7.38
Cnooc Limited6.84
PetroChina5.17
Tencent4.79
China Mobile3.68

Nifty 50

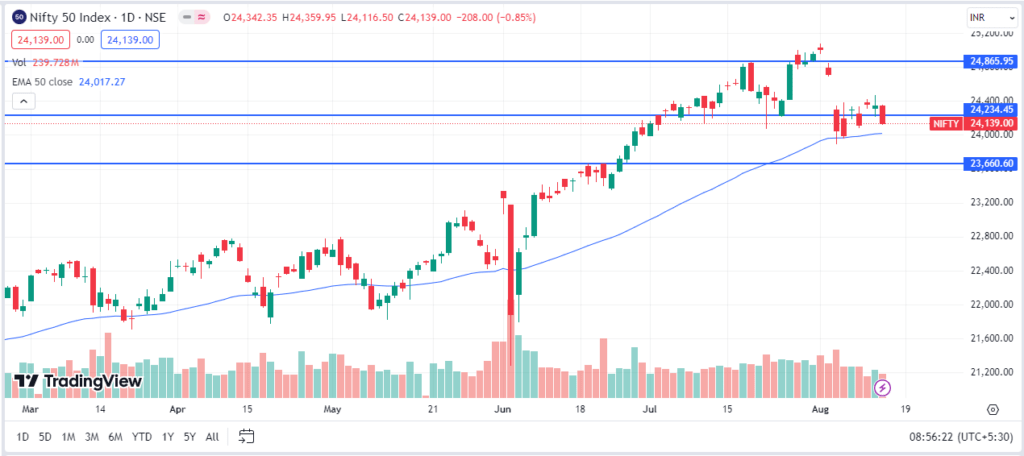
Amid high valuation concerns and volatility in the global market, the Indian stock market continues to trade on a negative. Top indices like the Nifty 50 have failed to recover the prior week’s losses. In the last five trading sessions, the Nifty 50 is slightly lower by 0.52% and is down by nearly 3.74% from its peak. 

z3
Source: TradingView

Looking at the daily chart of Nifty 50, the index trades closely above the 50-day moving average slope, providing support. The Nifty 50 needs to cover the gap with solid momentum to move higher. If it breaks the 50 DMA slope, the market may move much lower toward its next support at the 23,660 level. 

Unlike their Asian counterparts, the Finance, Non-Energy Minerals, and Communication sectors are the index’s worst performers. IT, Energy, Consumer Durable, and Nondurable stocks all support the index. 

The following are the top gainers in the last one week. 

StocksLast 7 Days Gains (in %)
ONGC6.70
JSW Steel4.71
Cipla4.66
Coal India2.69
Tech Mahindra2.59

The following are the top losers in the last one week across various sectors:

StocksLast 7 Days Loss (in %)
BPCL6.22
NTPC4.13
Grasim4.10
HDFC Life3.77
State Bank of India3.05
Source: NSE

Conclusion

As we move forward, global markets seem to stabilize after last week’s chaos and extreme volatility, driven by optimism around a potential rate cut in the US. However, uncertainties remain. Investors should stay cautious and closely monitor economic indicators and central bank actions in the coming weeks.

The extended slowdown in economic activity in the US has once again fueled recessionary fears in the country. Goldman Sachs’s economist increased the likelihood of a recession next year to 25% from 15%. This spooked investors worldwide, including the European stock market

Also, the unwinding of the Yen Carry Trades in the global market has caused a massive sell-off. According to a news report, Yen Carry Trades in the worldwide market was reportedly around $4 trillion last week. 

However, investor sentiment remains bearish as markets cool down from increased volatility. The economic indicators in the Eurozone area are not positive either. The report showed Retail sales declined by 0.3% month-over-month in June, compared to the expectation of 0.1%. 

With so much economic uncertainty surrounding the global market, the focus has shifted toward the central bank’s actions, including whether it will pursue an early rate cut.  

Top Gainers and Losers in the European Stock Market

Top Gainers

The following are the top gainers in the last one week. 

StocksLast 7 Days Gains (in %)
Rolls Royce6.24
KYGAA6.22
Haleon PLC5.68
Galderma Group5.26
Rational AG4.85
Source: Tradingview

Top Losers

The following are the top losers in the last one week across various sectors:

StocksLast 7 Days Loss (in %)
Banco Bilbao Vizcaya Argentaria13.93
Unicredit13.70
STMICROELECTRONICS13.92
PKOBP11.49
ASM International10.46
ABB Ltd.9.03%
Source: TradingView

During the week, the market’s losses were not limited to one sector. The sectors with the greatest losses are financials, producer manufacturing, technology services, and consumer non-durables. Despite the losses, the Electronic Technology and Health Technology sectors are showing strength in the market.

STOXX Europe 600

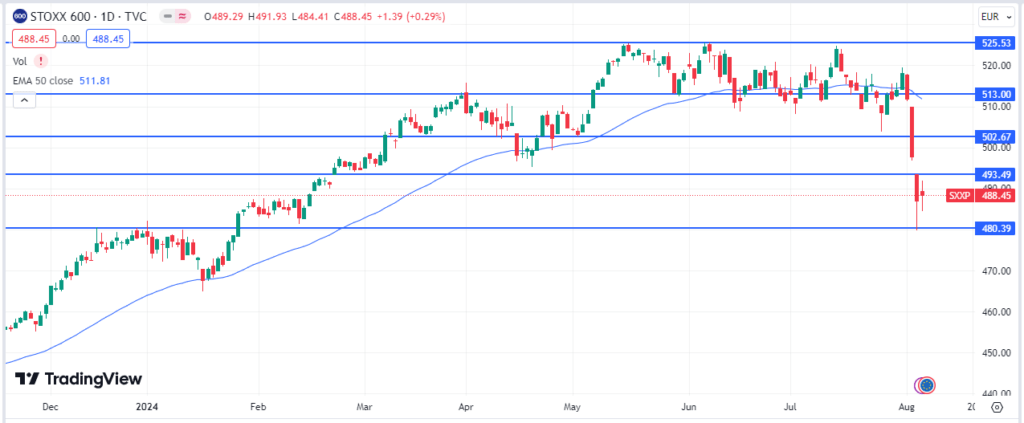
The STOXX Europe 600 index is Europe’s most extensive stock index, replicating almost 90% of the European market. The overall sentiment continues to be extremely bearish. As of 7 August, the index is down by 5.02% over the last five days.

q1

After the gap-down opening on Monday, the index trades on a bearish note. STOXX Europe 600 is now experiencing strong resistance at around 490. If the index fails to cover the gap or moves higher above the 500 level, weakness will likely persist. Below 480 is a strong support level. 

FTSE 100

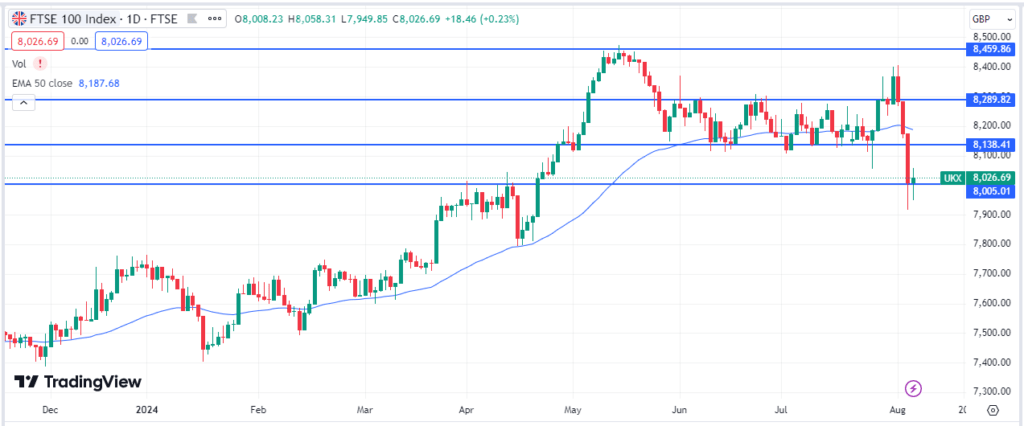
Last week, the UK’s Bank of England cut the short-term borrowing rates, bringing them down from a 16-year high level to support the economy and keep the growth momentum intact.  Also, The UK’s consumer price index stayed within the central bank’s 2% target in June.

q2

Despite the massive sell-off on Monday, the index closed above one of its key support levels at around 8,000 and is witnessing buying. The 8140 level is extremely resistive; the index might be challenging to break above it. If it breaks below the 8000 level, the next major support is around the 7700 level. 

CAC 40

The French economy is likely to have an Olympic ripple and is expected to grow by 0.3% in the third quarter, compared to the initial forecast of 0.1%. 

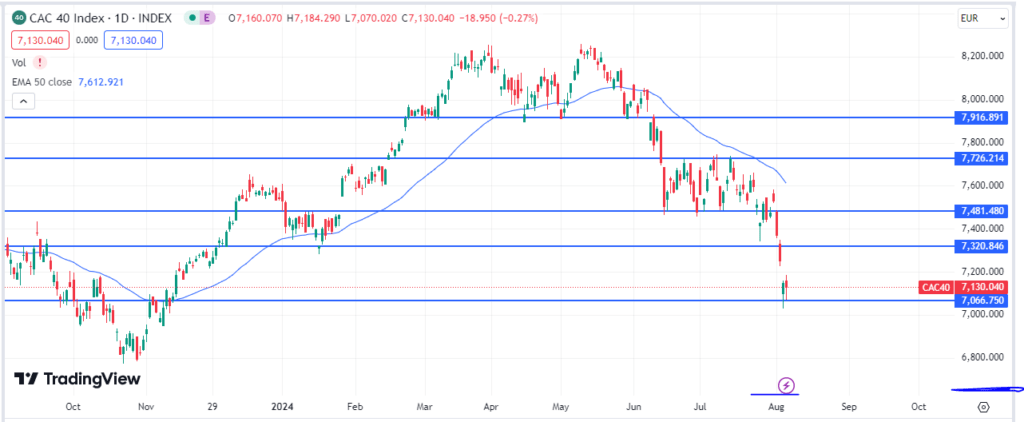
As of 7 August 2024, CAC 40, France’s primary stock market index, was down by 5.75% over the five days, showcasing extreme levels of volatility. Despite the cooling down, the market recovery was muted as traders avoided placing large bets, reassessed the impact of the pullback, and awaited new bullish triggers.

q3

CAC 40 broke below one of its key support levels at around 7,300 and has formed a head-and-shoulder pattern on the daily chart, which is a bearish formation. The index is now experiencing strong support at the 7,050 level, and to reverse the bearish formation, it needs to break above the 7,320 level with solid momentum. 

DAX

German factory orders rose for the first time in a year, backed by solid demand in the auto and metal sectors. However, the DAX 30 continues to witness extreme volatility. As of 7 August 2024, the index was down by more than 6.5% over the five days. 
q4

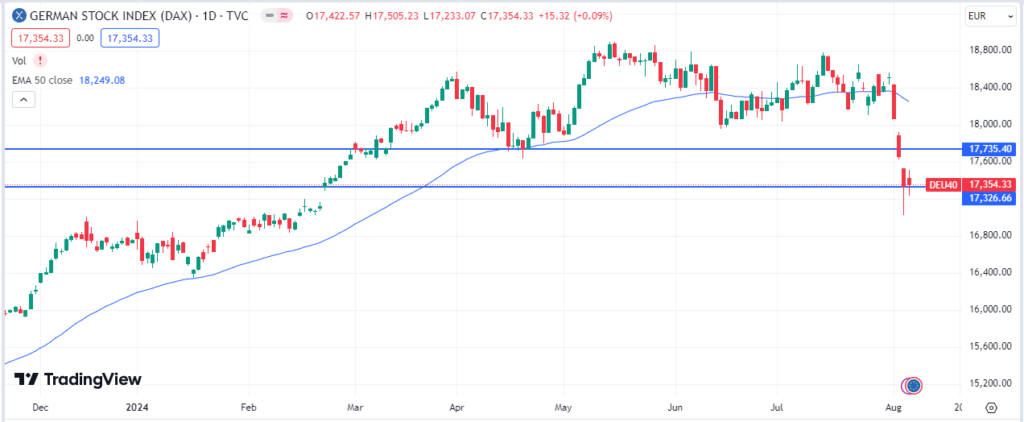
The European market’s overall momentum has turned negative. It is trading close to one of its major support levels, around 17,300. A break below could result in more selling. Conversely, the index needs to clear above the 17,750 level to break away from the bearish momentum. 

Conclusion 

Due to several factors, European stocks are expected to remain under pressure as we move forward. All eyes will be on central banks and their next moves, which will be crucial in determining the market’s direction. Keeping an eye on all market developments is crucial to making informed investment decisions amidst these rapidly evolving changes in the market. 

It was a pretty volatile week for the global market. A massive downturn in economic activities was reported across the world’s largest economy, and second-quarter corporate earnings were weak. The impact spilled over to other parts of the world, including Europe and Asia. 

Crude oil prices continued to fall this week, with Brent Crude dropping more than 6% to settle below $80. Meanwhile, gold maintains bullish momentum due to investors’ high-risk aversion. 

Let’s look at how the major stock market indices did this week

In the July meeting, the Federal Reserve decided to keep the interest rates on hold again on expected lines. But, the market was looking for the commentary in which Fed Chair Jerome Powell indicated strongly about the September rate cut. 

July non-farm payroll was below expectations. It rose by only 114,000, compared to the expectations of 185,000. The unemployment rate surged to 4.3%.

On the other hand, weak corporate earnings and guidance continue to hurt the world’s largest market. Amazon slipped more than 11% on Friday after revenue missed estimates and increased the capital expenditure needed to support the company’s AI program. Intel also nosedived more than 26% on Friday after the company handed out pink slips to 15,000 staff.

Let’s see how the world’s most tracked indexes performed.

Dow Jones

Amid recession fears in the economy caused by disappointing job data, companies handing out pink slips, and weak corporate earnings, the Dow Jones Industrial Average (DJIA) fell nearly 1.51% on Friday, bringing the total loss of the week to 2.10%. 

S&P 500

Disappointed economic data shocked investors and massive selling in tech stocks resulted in a pullback in the S&P 500 index. On Friday, the index was down by 1.84%, and the cumulative loss was 2.06% on a week-on-week basis. 

Nasdaq

Massive selling in tech stocks continued to hurt the tech-heavy index. On Friday, the Nasdaq fell by 2.43%, bringing its cumulative loss for the week to 3.35%. 

Weak investor sentiment in the US also impacted the European equity market. While the Eurozone economy expanded 0.6% on a year-on-year basis in the second quarter of 2024, initial estimates show that annual inflation in the region rose to 2.6% in July compared to 2.5% in June. Also, the unemployment rate ticked up to 6.5% in June. 

Let’s look at how the top three European indexes performed during the week. 

FTSE 100

The UK stock market was steady during the week, but it fell on Friday due to weakness in the global market. The Bank of England cut its key interest rate by 0.25% to 5.00%, the first reduction since the coronavirus pandemic began in March 2020.

On Friday, FTSE 100 was down by 1.33%, taking the weekly cumulative loss to 1.34%. 

CAC 40

Amidst the Olympics euphoria in Paris, CAC 40, the primary stock market index, was down by 1.64% on Friday’s session. The index concluded the week with a loss of 3.54%. 

DAX

Recessionary fears in the US and challenging economic conditions in Germany continued to hurt the German stock market. The DAX witnessed a sharp fall during the week. On Friday, the index was down by 2.39%, concluding the week with a cumulative loss of 4.11%. 

Following the global cues, the Asian market also traded weakly during the week. Domestic factors also affected the respective markets. Let’s examine how the primary stock market index performed during the week. 

Nifty 50

The Indian market had an incredibly volatile week. The market was buoyed by corporate earnings data that exceeded expectations. However, the market saw extreme volatility on Friday, with the Nifty 50 falling by 1.17%. On a weekly basis, it decreased by 0.80%. 

Nikkei 225

Disappointing macroeconomic data and the Bank of Japan’s hawkish stance on rate hikes resulted in a sharp fall in Nikkie 225. During the week, the Bank of Japan raised short-term interest rates to 0.25%.

The hike was the second time in the year. The Bank also indicated it would start tapering monthly bond purchases, moving away from the ultra-loose monetary policy. On Friday, Nikkei 225 fell sharply by 6.17%, and on a week-on-week basis, it was down by 4.67%. 

Straits Times

Following the global cues, Singapore’s primary stock market index traded on a bearish note. It was down by 1.14% on Friday and by 1.31% on a week-on-week basis.

Hang Seng

Chinese equities were mixed after disappointing manufacturing data dampened investor sentiment. On Friday, Hong Kong’s benchmark Hang Seng Index was down 2.12%, or 0.45%, from its weekly total loss.

Taiwan Weighted

The sharp decline in US tech stocks and recessionary fears due to slowing economic growth resulted in a big fall in the Taiwan Weighted Index. Taiwan is the top US trade partner and supports the global economy’s manufacturing supply chains. Any slowdown in the US and global economies will hurt the Taiwanese economy. 

On Friday, the Taiwan Weighted Index was down by 4.64%, wiping out the week’s gains. The total loss was 2.18%. 

KOSPI

South Korea’s headline inflation rose faster than expected in July, affecting investor sentiment. On Friday, the primary stock market index of South Korea, KOSPI, was down by 3.79%. On a weekly basis, the index fell 2.04%.

SET Composite

Thailand’s equity market index, SET Composite, was down by 0.74% during Friday’s session but closed the week higher by 0.45%.

Jakarta Composite

Bucking the global cues, the Indonesian stock market traded flatly during the week. On Friday, the Jakarta Composite was slightly down by 0.24%; on a week-on-week basis, it was up by 0.27%.

Shanghai Composite

China’s manufacturing Purchasing Managers’ Index (PMI) slipped to 49.4 in July from 49.5 in June, marking the third consecutive monthly contraction. 

Over the week, the Shanghai Composite traded flat. On Friday, it was down by 0.93%, but on a week-on-week basis, it was up by 0.50%. 

Wrapping Up

As we look ahead, market volatility is likely to persist as investor sentiment has turned negative. Closely watching the economic indicators, corporate earnings reports, and central bank commentary will help you gauge the future direction of the markets. As volatility persists, a cautious and well-diversified investment approach remains essential.

The US stock market is showcasing mixed performance due to heavy selling in tech stocks, disappointing second-quarter results from key industry players, and investors awaiting the outcome of the two-day Federal Reserve policy meeting that started on Tuesday.

On the economic front, CB Consumer Confidence rose from 97.8 in June to 100.5 in July, exceeding the forecast of 99.7. JOLT’s Job Openings decreased from 8.23 million in May to 8.18 million in June. In May, the Case-Shiller Home Price Index rose by 1.0% monthly, compared to the expected 1.2% increase.

Top Gainers and Losers in the US Stock Market

Top Gainers

The following are the top gainers in the last one week. 

StocksLast 7 Days
Gains (in %)
3M20.22
CBRE Group13.87
RTX Corporation12.63
Lockheed Martin9.99
AON9.79
Source:Tradingview

Top Losers

The following are the top losers in the last one week across various sectors:

StocksLast 7 Days
Loss (in %)
Nvidia 15.52
Tesla12.22
AMD10.66
AVGO10.52
Intel 8.59
Source: TradingView

The top gainers in the index continue to skew towards Electronic and Health Technology stocks. 3M is the top gainer in the S&P500 index because its strong earnings beat analysts’ expectations. CBRE Group’s stock also benefits from the robust earnings report. 

On the other hand, tech stocks, especially AI stocks like Nvidia and AVGO, are under extreme selling pressure because of valuation and demand concerns. Also, Tesla’s stock is impacted by weak Q2 earnings, which were way below analysts’ expectations.  

How did the US stock market indexes perform during the week?

Nasdaq 100

Broader pullbacks in tech stocks and weak earnings by key industry players like Tesla, Meta, and Alphabet have pressured Nasdaq. Traders are worried that high AI spending would hurt profits and that premium valuations of tech companies are not justifiable. 

On Tuesday (30th July 2024), the Nasdaq 100 continued to trade with a negative bias, losing 1.38%. The index has been down 3.49% in the last five trading sessions. 

n1 1
Source: Tradingview

Looking at the daily chart, the overall momentum of the index has turned negative. The index has broken below the 50-day Moving Average, offering firm support and moving further lower. The Nasdaq is now below one of its key support levels, 18,900. The next major support is at around 18,500. 

S&P 500

The S&P 500 index showcases resilience and falls less than the Nasdaq because of its diversified exposure and investors’ preference for defensive stocks amidst extreme volatility in high-growth tech stocks. 

On Tuesday (30th July 2024), the S&P 500 ended the day lower, down 0.50%. The index was down more than 1.2% in the last five trading sessions. 

n2 1
Source: Tradingview

The 50-day Exponential Moving Average slope strongly supports the index, coinciding with its primary support level of 5,450. A break below these support levels will turn the market’s momentum negative. The following two major support levels are approximately 5,370 and 5,260. 

Conclusion:

As we move forward, the market’s direction will likely hinge on the Federal Reserve’s policy meeting outcomes and the ongoing earnings season. The tech sector’s performance will be closely watched, especially given recent volatility. Investors should remain cautious, focusing on diversified portfolios and defensive stocks to navigate the current market uncertainty.

It was a volatile week for the global market, with almost all major indices closing in the red. Mixed sentiment in the US market due to the significant sell-off in tech and AI stocks, lower-than-expected corporate earnings in the technology and luxury goods sectors weighing on stock market returns, and a slowdown in major Asian economies dragged the market down.

Crude oil prices continued to fall this week, with Brent Crude dropping more than 5% to settle below $81. Meanwhile, gold climbed 2.43% to a new all-time high.

Let’s look at how the major stock market indices did this week

The US market was extremely volatile during the week as small-cap stocks outshined large-cap stocks for the second consecutive week. The $1 trillion sell-off in big tech stocks after disappointing earnings releases from Google and Tesla. Both stocks lost 7.51% and 10%, respectively, during the week. 

In June, the inflation stayed steady at an annual rate of 2.6%, not far above the 2% target for the Federal Reserve’s inflation path, which again increases the probability of a September rate cut. 

Let’s see how the world’s most tracked indexes performed.

Dow Jones

Amidst the market volatility, the Dow Jones Industrial Average (DJIA) fell amid a surge during Friday’s session and was up by 1.64%, led by 3 M’s better-than-expected performance. Friday’s surge helped the index recover its losses during the week and close with gains of 0.75%.

S&P 500

Favorable inflation and consumer spending data helped the S&P 500 gain ground on Friday. It was up by 1.11% during the day, but it concluded the week with a cumulative loss of 0.83%. 

Nasdaq

Tesla and Google wiped $1 trillion in value of U.S. equities, indicating a broad-based correction may come. NASDAQ was up by 1.03% on Friday, but it concluded the week with a cumulative loss of 2.08%. 

European equity markets fell midweek as earnings in the technology and luxury goods sectors weighed on returns. Further, selling in tech stocks in the US also contributed to the bearish momentum. 

Let’s look at how the top three European indexes performed during the week. 

FTSE 100

In contrast to the slowdown in major European economies, the UK economy is showing signs of good health. It continues to be one of the best-performing economies in the European region. On Friday, the index was up by 1.20%, and on a week-on-week basis, it was up by 1.59%. 

CAC 40

The country’s focus has now turned towards the Olympics, and it is expected to benefit economically from them. In Friday’s session, CAC 40 was up by 1.21%, which helped to recover some of the weekly losses. The index concluded the week with a slight loss of 0.22%. 

DAX

Germany continues to face challenging economic conditions, and the steep fall in manufacturing and services activity is leading to a slowdown similar to those in the Eurozone economy.

Following the broader cues in the European market, the DAX went higher during Friday’s session. It was up by 0.65% and 1.35% week-on-week. 

The rout in US tech stocks caused most Asian indexes to trade lower this week. Furthermore, domestic factors influenced the market. Let us take a closer look at how the various Asian indices performed during the week.

Nifty 50

The Indian market experienced a particularly volatile week. On Friday, the Nifty 50 and the Sensex broke their five-day losing streak. The better-than-expected release of earnings data by IT companies contributed to the market’s positive momentum. On Friday, the Nifty 50 rose by 1.76%, up 1.50% weekly. 

Nikkei 225

Japanese technology stocks remained under pressure as shares of U.S. mega-cap technology companies experienced significant selling pressure. Japan’s stock markets witnessed sharp weekly losses, with the Nikkei 225 Index down 6.0%.

Straits Times

Bucking the market’s overall trend, Singapore’s primary stock market index was flat on Friday and down 0.12% weekly, ending the week 0.61% lower.

Hang Seng

Weaker-than-expected economic growth put Chinese stocks under pressure. In Hong Kong, the benchmark Hang Seng Index rose by 0.10% on Friday. However, every week, the index fell by 2.28%.

Taiwan Weighted

Following the cues from the global market and its Asian peers, the Taiwan Weighted index fell by 2.31% in Friday’s session. On a weekly basis, the index was down by 4.38%.

KOSPI

South Korea’s economy unexpectedly contracted in the second quarter, marking the sharpest contraction since 2022, as falling consumer spending impacted exports. GDP for April-June fell 0.2% from the previous quarter. KOSPI, South Korea’s primary stock market index, was up by 0.78% on Friday. On a weekly basis, the index fell 2.27%.

SET Composite

Thailand’s equity market index, SET Composite, was up by 1.20% during Friday’s session and down by 0.75% week-on-week.

Jakarta Composite

The Indonesian stock market failed to gain enough positive momentum during the week to close higher. On Friday, the index was up by 0.66%; on a week-on-week basis, it was slightly down by 0.09%.

Shanghai Composite

Chinese stocks fell after the central bank’s unexpected rate cuts failed to boost economic confidence. The People’s Bank of China has reduced the one-year medium-term lending facility rate to 2.3% from 2.5%. The Shanghai Composite Index fell 3.07% week on week.

Wrapping Up

As we look ahead, market sentiment remains cautious despite the sell-off of AI stocks. Closely watching the economic indicators and corporate earnings reports will help gauge the markets’ future direction. With ongoing volatility, staying informed and considering long-term investment strategies is crucial to navigating the uncertainties.

Global market sentiment remains low, with weak US and European stocks leading the way. With central banks in the United States and Europe painting a bleak picture of the economy and a persistent slowdown in economic activity in China, investor sentiment in the Asia stock market has remained low.

Crude oil prices have also fallen dramatically over the last week. Brent Crude has dropped more than 4% and is currently trading around $81 due to a weak demand forecast. On the other hand, gold prices have begun to rise again.

Let’s look at how the top Asian indexes performed during the week. 

Nikkie 225

The lack of positive economic indicators continues to hurt the Japanese stock market. The momentum remains largely negative as the country struggles to revive growth. In the first quarter of 2024 (Jan to March), the economy fell faster than expected, shrinking by 2% annually. 

Traders are now looking forward to July’s Services PMI numbers. A higher Services PMI would raise investors’ expectations of a July Bank of Japan rate hike. 
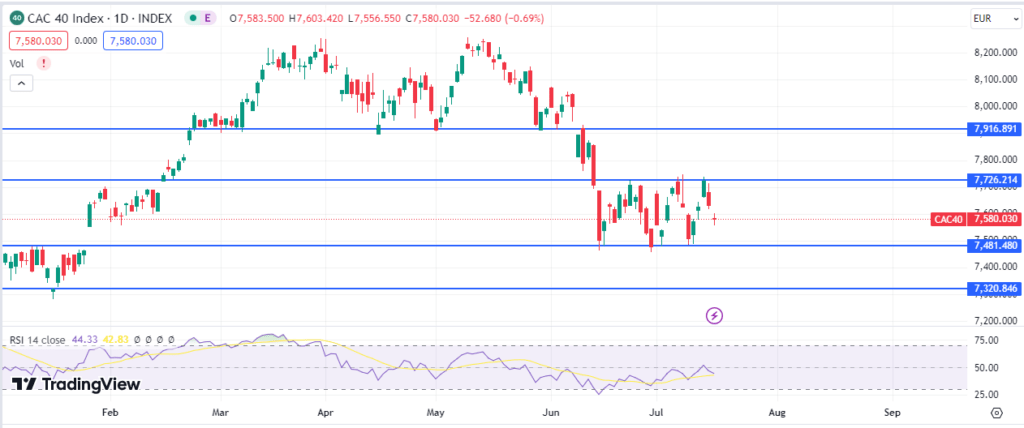
The services sector employs more than 70% of Japan’s workforce. Rising service sector activity would increase employment, boosting wage growth and consumer spending. The week starting 22nd July 2024, the Nikkei 225 has been trading with a negative e-bias. The index has been down by about 4.34% in the last week.
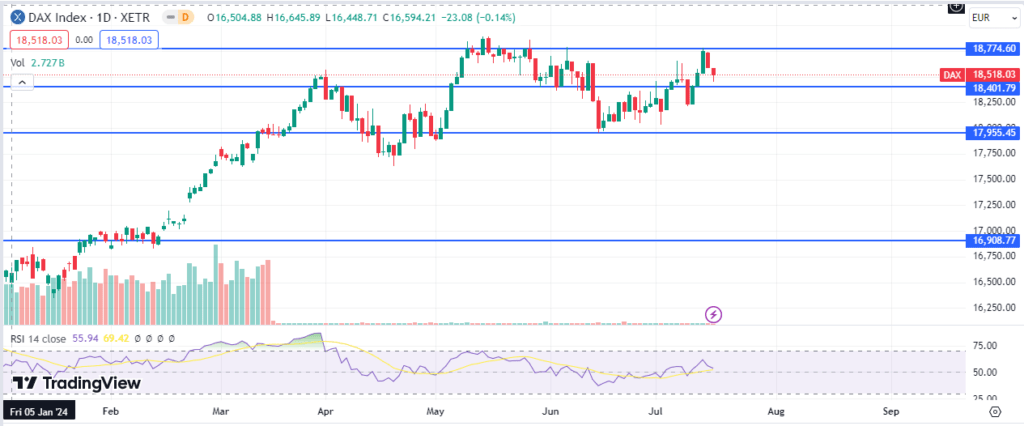
w1
Source: TradingView

The daily chart of the Nikkei 225 index shows that it has turned from the 41,000 level and is going south, as it failed to gain enough buying momentum. The 39,000 level below looks to be a strong support level for the index. If the market finds it too difficult to gain upside momentum and breaks its immediate support at the 39,000 level, then the next major support is at the 37,000 level.

The sectors driving the market down are Producer Manufacturing, Consumer Durables, and Electronic Technology.

StocksLast 7 Days
Gains (in %)
Tokyo Electron14.57
Disco Corporation12.46
Hitachi7.2
SONY5.99
Misthubisi Heavy Industries5.58
Source: TradingView

Hang Seng

China’s GDP increased by 4.7% year on year in the second quarter of 2024, falling short of expectations and slowing from 5.3% growth in the first quarter.

On Monday, July 22, the People’s Bank of China surprised the market by announcing policy measures to boost the Chinese economy. Loan prime rate and Reserve Requirement Ratio cuts focused on Beijing’s worries over slower-than-expected growth in the second quarter of 2024.

w2
Source: TradingView

Meanwhile, Hang Seng continues to trade on a bearish note. The index has been making lower lows and lower highs on the daily chart, signaling a downtrend. And it has also broken below the 17,500 level, a critical support level. The next major support is at around 17,180 and 16,500 levels. 

Energy Minerals, Technology Services, Producer Manufacturing, and Consumer Non-Durable stocks were the top losers of the week.

Hang Seng Top losers in the last week

StocksLast 7 Days
Gains (in %)
Zijin Mining Group Co. Ltd14.55
PetroChina11.13
CNOOC Limited7.62
China Resources Land7.48
Nongfu Spring Co Ltd5.38

Nifty 50

The Indian stock market was highly volatile during the past week because of mixed global signals and the new government’s first union budget. Because of the increased volatility, the Nifty 50 returned from 24,854.80 (its all-time level) this week. 

However, overall momentum continues to be positive. The improving outlook of the major IT companies contributed to the index’s growth in the past few sessions. This week, both the Nifty 50 and Sensex hit fresh record highs. However, in the last five trading sessions, the Nifty 50 has been slightly lower by 0.59%. 

w1 1
Source: TradingView

Looking at the daily chart of Nifty 50, the index failed to move higher and made its all-time high level as a new resistance. To resume the upside trajectory, it must clear above this level with solid momentum. Below, the 24,230 level is likely to support the index strongly. On RSI, we can see that the current upside momentum is weakening.

Like the global market, the Energy, Minerals, and Finance sectors are the top losers, while the IT sector stocks gained the most. 

The Top Gainers in The Last Week

StocksLast 7 Days
Gains (in %)
Titan8.37
ITC8.02
Infosys6.57
HUL3.72
TCS3.48

The Top Losers in the last one week

StocksLast 7 Days
Loss (in %)
Bajaj Finance7.45
Reliance6.96
Shriram Finance5.54
Axis Bank4.47
Kotak Mahindra Bank3.59

Conclusion

As markets navigate these challenging times, investors will likely stay cautious, closely watching economic indicators, central bank actions, and corporate earnings. The next few weeks will be crucial in determining whether the markets can regain their footing or continue on a downward trajectory.

Lack of triggers and profit booking led major global indexes to end the week lower. This pullback might be due to investors strategizing their future moves or waiting for more data to make informed decisions.

The global IT outage on Friday had minimal impact on stock markets worldwide.

Crude oil prices fell during the week, with Brent Crude dropping 2.85% to settle below $87. Meanwhile, gold experienced upward pressure, rising 2.95% and reaching a new all-time high.

Let’s take a look at how the major stock market indices did this week.

The US market was mostly flat during the week and witnessed heavy profit booking tech stocks as investors diversify from tech giants. Experts beleive financials and energy may see increased interest. Investors are now waiting for the Federal Reserve’s next move amid slowing down of inflation.

Let’s see how the world’s most tracked indexes performed.

Dow Jones

Dow Jones fell amid a broad pullback in the equity markets. Overall the sentiment of the market is a bit negative. On Friday, the index pulled back by 0.93%, and on a week-on-week basis, the index was up by 0.72%. 

S&P 500

The SP500 index pulled back on Friday’s session as traders focused on a global IT outage caused by a Crowdstrike software update. It was down by 0.71%. The index is currently testing for support at the 5500 level. On a week-on-week basis, the index was down by 1.97%. 

Nasdaq

NASDAQ fell to new lows as traders continued to sell tech stocks in the midst of a global IT outage while diversifying their portfolios. On Friday, the index was down by 0.81% and concluded the week with a cumulative loss of 3.65%. 

The European Central Bank (ECB) kept its key interest rate unchanged at 3.75% at its most recent meeting, which was on expected line. It stated that it would not offer anguidance to specific rate paths and that economic data would guide its decisions. 

ECB President Christine Lagarde said a September move was wide open, adding that risks to economic growth were “tilted to the downside” and that inflation would remain stable for the rest of the year before falling in the second half of 2025.

Let’s look at how the top three European indexes performed during the week. 

FTSE 100

Despite improving economic indicators, the FTSE 100 lost its positive momentum, giving up its gains from the previous week. The UK GDP increased by 0.4% in May, following zero growth in April. On a rolling three-month basis, the economy grew by 0.9%, its fastest rate since 2022.

On Friday’s session, the index was down by 0.60% and on a week-on-week basis, it was down by 1.18%. 

CAC 40

Political and economic uncertainty have impacted Europe’s third-largest stock market. Following the cues from the global market, CAC 40 was down by 0.69% on Friday’s session and on a week-on-week basis, it fell by 2.46%.

DAX

Slowing economic growth continues to be a challenge for the German economy. The IMF has predicted Germany’s economy to grow by 0.2% in 2024, and 1.3% in 2025. On Friday, the index closed 1.01% lower and on a week-on-week basis, it was down by 3.07%. 

Following the cues from the US and European market, most of the Asian indexes traded lower during the week. Also, domestic factors influenced the market. Let’s take a closer look at how the various Asian indices performed over the week. 

Nifty 50

Profit booking on Friday wiped out most of the week’s gains. The market rose at the start of the week due to better-than-expected performance by IT companies but lost ground as profit booking took place. On Friday, the Nifty 50 fell 1.09%, while it rose 0.40% week on week. 

Nikkei 225

Japan’s stock markets fell over the week. Technology stocks fell as investors became concerned about tighter US restrictions on advanced semiconductor technology exporters to China, including several Japanese chip makers. On Friday, Nikkei 225 was down by 0.16% and on a weekly basis, the index was down by 2.74%. 

Straits Times

Singapore’s primary stock market index was down by 0.68% on Friday and on a week on week basis, it ended the week lower by 1.44%.

Hang Seng

Weaker than expected economic growth kept the Chinese stocks under pressure. In Hong Kong, the benchmark Hang Seng Index retreated by 2.07% in Friday’s session, and on a week-on-week basis, the index recorded a cumulative loss of 4.79%. 

Taiwan Weighted

Following the cues from the global market and its Asian peers, Taiwan Weighted index fell by 2.31% in Friday’s session. On a weekly basis, the index was down by 4.38%.

KOSPI

KOSPI, South Korea’s primary stock market index, fell 1.03% on Friday, maintaining the bearish trend. On a weekly basis, the index fell 2.15%.

SET Composite

Thailand’s equity market index, SET Composite extended losses during Friday’s session, and was down by 0.58%. On a week-on-week basis, the index fell by 1.12%.

Jakarta Composite

The Indonesian stock market failed to continue the upside momentum and was down by 0.36% on Friday’s session. Weekly, the index fell by 0.45%.

Shanghai Composite

Chinese stocks rose as investor sentiment remained largely unaffected by slower-than-expected economic growth in the second quarter. The Shanghai Composite Index rose 0.17% on Friday’s session, and on a week-on-week basis, it was up by 0.37%. 

Wrapping Up

Looking ahead, the current pullback in global markets paints a mixed picture. While the lack of immediate triggers and profit booking has caused major indexes to end the week lower, it also suggests that investors are reevaluating their strategies, possibly waiting for more data before making informed decisions. 

As we move forward, the focus will be on key economic indicators and central bank decisions, which are likely to influence investor sentiment and market direction. Keeping an eye on these developments will be critical for navigating the markets over the coming weeks.

Introduction

Multiple factors kept European stocks under pressure the week starting July 17, 2024, led by the decline in commodity stocks. Many luxury brands, like Germany’s Hugo Boss and the UK’s Burberry, either cut down on full-year sales outlook or issued profit warnings on weak luxury demand, showcasing weak consumer sentiment. 

However, what supported the market was dovish commentary from Fed Chair Jerome Powell, suggesting earlier-than-expected rate cuts and not waiting for inflation to get down to 2%, thus fueling speculation of multiple rate cuts. 

The emerging political scenario in the US will also likely affect the European market in the coming days. European stocks are also being impacted by the waning Chinese economy. In Q2, the Chinese economy grew by 4.7% year-on-year, down from 5.3% in Q1. This slowdown is adversely affecting German companies that deal in luxury goods. 

Eurozone industrial production fell by 2.9% year on year in May, following a 3.1% drop in April. Much of the attention is now focused on Eurozone inflation data, which will be released today (Wednesday), and the ECB press conference on Thursday.

Top Gainers and Losers in the European Stock Market

Top Gainers

The following are the top gainers in the last one week. 

StocksLast 7 Days
Gains (in %)
Kongsberg Gruppen 20.83
Ashtead Group6.88
ROCHE6.06
Segro Plc4.35
LIFCO AB5.46
Source: Tradingview

Top Losers

The following are the top losers in the last one week across various sectors:

StocksLast 7 Days
Loss (in %)
Swatch Group8.31
Verallia7.86
KGHM5.51
Kering4.71
Galp Energia4.41
Source: TradingView

Know More: Can The 15x15x15 Rule Help You Become a Crorepati?

The losers in the European market mainly belong to the Consumer Durables, Energy Minerals, Non-Energy Minerals, and Consumer Non-Durable segments. The Producer Manufacturing, Finance, and Health Technology segments showcase market strength.

Now that you know the top gainers and losers in the European stock markets, let’s see how the European indices fared during the week.

STOXX Europe 600

STOXX Europe 600, the largest stock index replicating almost 90% of the European stock market, is trading weak. With deteriorating investor sentiment and suggested recovery in the Euro economy looking bumpy, the index is likely to deal with a bearish note unless there is a monetary push by central banks. 

e1
Source: TradingView

STOXX 600 failed to break above 525 for the third time in a row, indicating that it has become highly resistant. The Relative Strength Index, a momentum indicator, is falling, indicating a loss of bullish momentum. The 510 and 500 levels below provide strong support for the index. 

FTSE 100

Despite improving economic indicators, the FTSE 100 failed to maintain its positive momentum, giving up its gains in the previous week. 

UK GDP increased by 0.4% in May, following zero growth in April. Increases in service and construction output fueled the increase. On a rolling three-month basis, the economy expanded by 0.9%, the fastest rate since 2022. 

d2
Source: TradingView

After failing to break above the resistive 8,290 level for the fourth time in a row, the index showcased weakness and fell toward its immediate support level of 8,140. A break below this level could trigger further weakness in the market and send it below the 8,000 level. The RSI index is also below 50, suggesting weak momentum in the market. 

CAC 40

Political and economic uncertainty has put pressure on the stock market of the third-largest country in Europe. Experts suggest the country will not gain much economically from the Paris Olympics and is projected to grow by 0.3 percentage points this quarter due to the games. 

d3 1
Source: TradingView

CAC 40 has failed to break above the resistive 7,726 level this week and reversed its momentum, erasing the gains it made the previous week. Currently, there is strong support at the 7,480 level, and if it breaks below, we may see more weakness in the market. 

DAX

Germany, Europe’s largest economy, has been severely impacted by weak consumer demand. It was the only G7 economy that contracted last year and is expected to grow slowly again this year. Declining exports, political uncertainty, and central banks’ unclear monetary policies have all contributed to lower consumer sentiment. The ZEW Economic Sentiment Index fell from 47.5 to 41.8 in July, missing expectations and capping an eight-month streak of increases.

d4
Source: TradingView

DAX pulled back at the start of the week after trying to break above the 18,800 level but failed. It is moving towards one of its strong support levels at around 18,400. The overall momentum continues to be weak, and if it breaks below the 18,400 level, it may test for support at the 18,000 level. 

Conclusion 

Due to several factors, European stocks are expected to remain under pressure as we move forward. The emerging political landscape in the US, along with the impact of China’s slowing economy, will likely influence European markets in the coming days.

Key indices like the STOXX Europe 600, FTSE 100, CAC 40, and DAX exhibit bearish sentiment. The outlook for European stocks remains cautious, and strategic investment decisions will be crucial in navigating this challenging environment.

The global market sentiment was positive throughout the week, with the top US indices reaching new highs, the European market reversing its downward trend, and Asian indices trading with a positive bias due to the overall improvement in global economic conditions. 

Crude oil prices remained largely stable and closed the week flat, with Brent Crude trading around the $87 mark. However, gold experienced upward pressure and ended the week up 3.64%. 

Let’s look at how the major stock market indices did this week

IndexPrevious Day Change (%)WoW Change (%)
US Markets
Dow Jones0.621.59
S&P 5000.550.87
Nasdaq0.630.25
European Markets
FTSE 1000.360.60
CAC 401.260.63
DAX1.141.48
Asian Markets
Nifty 50 0.770.73
Nikkei 225-2.510.68
Straits Times0.652.55
Hang Seng2.522.77
Taiwan Weighted-1.981.53
KOSPI-1.20-0.18
SET Composite0.201.53
Jakarta Composite0.371.48
Shanghai Composite0.030.46 

Several factors supported the US market this week, the most important of which was a slowing of inflation. Consumer prices dropped for the first time in four years. In June, headline prices fell by 0.1%, while core prices rose by 0.1%, the slowest pace in three years.

Let’s see how the world’s most tracked indexes performed. 

Dow Jones

A broad rally in the equity markets pushed the Dow Jones to record highs this week, breaking above 40,000 for the first time. The index was up 0.62% on Friday, ending the week up 1.59%.

S&P 500

Traders reacted to the positive CPI numbers, which helped the S&P500 index test new highs on Friday. The index was up by 0.55% and settled above the crucial 5650 level at the close of Friday’s session. On a week-on-week basis, it was up by 0.87%. 

Nasdaq

Tech stocks witnessed a volatile session this week due to profit booking, but they managed to close the week on a higher note. On Friday’s session, the Nasdaq was up by 0.63%, concluding the week 0.25% higher. 

Despite the ongoing political uncertainty in Europe, the markets traded with a positive bias, influenced by the US markets and improving economic indicators in Europe.

Let’s look at how the top three European indexes performed during the week. 

FTSE 100

UK GDP grew by 0.4% in May, after reporting zero growth in April. The uptick was driven by growth in services and construction output. On a rolling three-month basis, the economy grew by 0.9% , the fastest pace since 2022. In Friday’s session, FTSE 100 was up 0.36%, but concluded the week with a cumulative gain of 0.60%. 

CAC 40

Positive momentum continued throughout the week, ignoring the country’s political uncertainty. CAC 40, the primary stock exchange of France, rose by 1.26% on Friday, and on a week-on-week basis, it closed 0.63% higher. 

DAX

Overall, strength in the German equity market helped the DAX conclude the week on a higher note. On Friday, the index closed 1.14% higher, and on a week-on-week basis, it was up by 1.48%. 

Taking cues from the US and European markets, most Asian indexes traded on a positive note during the week. Domestic factors also influenced the market. Let’s take a closer look at how the various Asian indices performed over the week. 

Nifty 50

Profit booking, concerns over valuation, and the start of the corporate earning season kept the market highly volatile but closed the week higher. In Friday’s session, Nifty 50 was up by 0.77%, which helped the index to close the week on a positive note and was up by 0.73. 

Nikkei 225

At the end of the week, Japanese stocks retreated from their record highs reached on Thursday. Nikkei 225 fell by 2.51% on Friday, pulling down the overall weekly gain to 0.68%. 

Straits Times

Throughout the week, Singapore’s primary stock market index remained bullish. It increased by 0.65% on Friday and nearly 2.55% week on week to end the week positively. 

Hang Seng

Strong export data in June and China’s consumer price index rising a lower-than-expected 0.2% from a year earlier, narrowing from May’s 0.3% rise, helped lift the Hang Seng index. The index rose 2.52% on Friday and 2.77% week over week. 

Taiwan Weighted

The Taiwan Weighted index had a mixed week. On Friday, it was down by 1.98%, bringing its weekly cumulative gain to 1.53%.

KOSPI

KOSPI fell 1.20% on Friday, breaking a streak of five consecutive weeks of gains. On a weekly basis, the index fell by 0.18 percent.

SET Composite

Thailand’s equity market index, SET Composite, reported a modest gain on Friday’s session and was up by 0.20%. On a week-on-week basis, the index rose by 1.53%.

Jakarta Composite

The Indonesian stock market maintained its upward trend and rose throughout the week, reaching a 0.37% high on Friday. The index increased by 1.48% weekly.

Shanghai Composite

Shanghai Composite failed to capture the positive economic indicators released on Friday. The index traded flat on Friday and gained 0.46% by the end of the week. 

Wrapping Up

The encouraging economic indicators from the United States and Europe helped the global stock market trade on a high note. Moving forward, the announcement and reporting of corporate earnings are likely to influence market trends. To successfully navigate changing market dynamics, it will be necessary to closely monitor economic and corporate earnings reports, as well as sector-specific performance.

No more posts to show

Frequently asked questions

Get answers to the most pertinent questions on your mind now.

No FAQs found in this category.

What is an Investment Advisory Firm?

An investment advisory firm is a company that helps investors make decisions about buying and selling securities (like stocks) in exchange for a fee. They can advise clients directly or provide advisory reports and other publications about specific securities, such as high growth stock recommendations. Some firms use both methods, like Research & Ranking, India’s leading stock advisory company, specializing in smart investments and long-term stocks since 2015.

An investment advisory firm is a company that helps investors make decisions about buying and selling securities (like stocks) in exchange for a fee. They can advise clients directly or provide advisory reports and other publications about specific securities, such as high growth stock recommendations. Some firms use both methods, like Research & Ranking, India’s leading stock advisory company, specializing in smart investments and long-term stocks since 2015.

An investment advisory firm is a company that helps investors make decisions about buying and selling securities (like stocks) in exchange for a fee. They can advise clients directly or provide advisory reports and other publications about specific securities, such as high growth stock recommendations. Some firms use both methods, like Research & Ranking, India’s leading stock advisory company, specializing in smart investments and long-term stocks since 2015.

An investment advisory firm is a company that helps investors make decisions about buying and selling securities (like stocks) in exchange for a fee. They can advise clients directly or provide advisory reports and other publications about specific securities, such as high growth stock recommendations. Some firms use both methods, like Research & Ranking, India’s leading stock advisory company, specializing in smart investments and long-term stocks since 2015.

Who we are

SEBI registered investment advisory services

Media, Award & Accolades

Stay updated with our winning journey

Video Gallery

Watch our exclusively curated financial videos

Performance

Know the journey of stocks

Newsletters

Stay on top of the stock market

Contact us

Stay in touch

5 in 5 Strategy

A portfolio of 20-25 potential high-return stocks

MPO

1 high-growth stock recommendation/ month, that is trading below its intrinsic value

Combo

A combined solution of 5-in-5 wealth creation strategy & mispriced opportunities

Dhanwaan

Manage your portfolio with dhanwaan

Informed InvestoRR

A step by step guide to sharpen your investing skills

EPW Coming soon

A concentrated portfolio of 12-18 high-growth & emerging theme stocks

Pricing

Choose from our range of pricing packages