
Studying chart patterns gives traders an edge, setting them apart from others. These patterns visually display price and volume changes in stock trading sessions, revealing the battle between bullish and bearish investors.
Chart patterns fall into two categories: continuation and reversal. A reversal pattern occurs when a stock’s price changes direction from its prior trend. The rounded bottom chart pattern is one such reversal chart pattern. This article explores the characteristics and trading strategies of the rounding bottom pattern.
What is a Rounding Bottom Pattern?

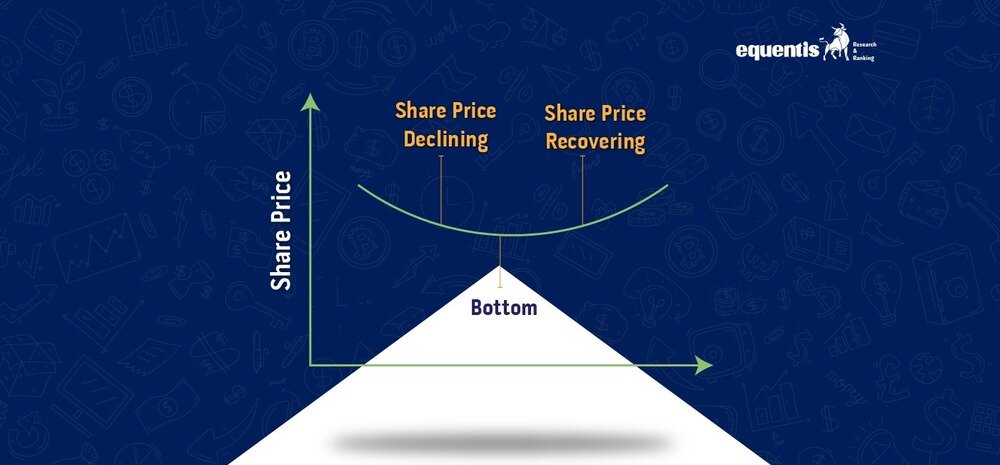
The rounding bottom pattern, also called the saucer bottom, is a chart pattern used in technical analysis to spot the end of a downtrend and the shift to an uptrend. It’s like a U shape and contrasts with the topping pattern, a rounding top.
This pattern features a U-shaped formation and a neckline as a resistance level. It starts with a downward slope and then shifts to an upward one. When the price breaks above the resistance line, the pattern is confirmed, suggesting a new uptrend. As recently as November 2023, this pattern was seen in the rounding bottom stocks of Union Bank, PTC India, and Geojit Financials.
How is the rounding bottom pattern formed?
The rounding bottom chart pattern develops in defined stages, and grasping these stages helps identify and validate the pattern effectively. Let’s delve into how and when a rounding bottom typically takes shape:

- Downtrend Phase: Initially, there’s a prolonged downtrend in the asset’s price, marked by consistent lower lows and lower highs on the chart. This phase reflects a bearish market sentiment.
- Accumulation Phase: During the downtrend, buyers gradually accumulate the asset at lower prices due to improving fundamentals, positive news, or shifting market sentiment.
- Flattening Out: The distinct feature of a rounding bottom is the gradual flattening of the price movement, forming a smooth, rounded curve resembling a saucer or bowl. This signals diminishing selling pressure and increased buyer activity.
- Decreasing Volume: Trading volume declines as the rounding bottom forms, indicating reduced selling pressure and market stabilization, with investors less interested in selling at lower prices.
- Support and Resistance Levels: Traders identify two crucial levels during the pattern formation: the support level (the lowest point) and the resistance level (the highest point of the rounded curve), which define the pattern’s boundaries.
- Confirmation via Breakout: The rounding bottom pattern completes when the price breaks above the resistance level, signaling a potential reversal from the downtrend. Ideally, this rounding bottom pattern breakout is accompanied by increased trading volume, confirming the strength of the new uptrend.
- Price Target Projection: Traders often estimate a price target for the upward movement post-breakout by measuring the height of the rounding bottom pattern (distance between support and resistance levels) and projecting this upward from the breakout point.
Trading the rounding bottom pattern:
Trading the rounding bottom pattern stocks requires a systematic approach for effective results. Here are some important considerations:
- Entry and Exit Points: Look for long positions when the price breaks above the resistance level, signaling a potential uptrend. Conversely, if the price hits your target and starts to stall or reverse, close the trade to lock in profits.
- Volume Confirmation: Confirm the pattern with increased trading volume during the breakout, indicating a stronger market conviction.
- Price Targets: Estimate potential gains by measuring the height of the cup, that is, the distance between the lowest point and the peak of the rounding bottom. Now, project this distance upward from the breakout point. This will be your estimate of where the stock price can reach.
- Stop-Loss Orders: Protect against losses by placing stop-loss orders just below the resistance level to guard against false breakouts.
- Timeframes: Rounding Bottom patterns can appear across different timeframes, so select one that aligns with your trading strategy.
- Risk-reward ratio: Assess trade risks and rewards. Confirm whether potential gain justifies potential loss by checking the distance from the price to the price target and the stop loss. A good ratio is usually 2:1 or higher.
Drawbacks of the rounding bottom pattern:
The rounding bottom pattern in technical analysis is functional but has limitations. It can sometimes give false signals, leading to bullish reversals and risking losses if not managed carefully. This pattern takes time to form and is more suitable for long-term investors than short-term traders. Confirmation with a breakout above the resistance line is crucial; otherwise, the rounding bottom remains speculative.
External factors like economic events can affect its reliability. While it indicates sentiment change, it doesn’t ensure a lasting bullish trend, sometimes resulting in only temporary recoveries. Depending solely on the rounding bottom can be harmful; it should complement other analysis tools. Traders and investors should be cautious, manage risks effectively, and consider the broader market context when using this pattern.
Conclusion
Though less famous than other patterns, the rounding bottom is valuable for traders seeking buying opportunities. Understanding its key features and signals will help you make informed decisions and profit from market shifts. However, the rounding bottom must be foolproof and have limitations. This pattern can be used with other analyses to make well-informed trading choices.
To learn about the calculations behind the rounding bottom and other indicators, consult a SEBI-registered advisory. They will help you read stock charts, identify suitable long-term stocks to buy, and learn more about ‘investing vs. trading’ to find the best approach for your investing journey.
Know more about
IPO | Current IPO | Upcoming IPO | Listed IPO
What is the rounding bottom pattern?
The rounding bottom pattern, or saucer bottom pattern, signals a bullish reversal after a downtrend. It suggests a shift in price direction, with bears weakening and bulls taking charge. This pattern, resembling a bowl or saucer, forms after a prolonged decline.
Is rounding top bullish or bearish?
A rounding top chart pattern suggests a possible reversal from an uptrend, commonly seen as bearish in technical analysis. It signifies a long-term shift from bullish to bearish trends at the end of an upward market movement.
How accurate is the rounding bottom pattern?
The rounding bottom chart pattern is viewed as uncommon by traders. It signals a bullish market reversal, tracking and confirming a stock's price movement, but it also has limitations. Like any indicator, it's best used alongside other tools for optimal results.
I’m Archana R. Chettiar, an experienced content creator with
an affinity for writing on personal finance and other financial content. I
love to write on equity investing, retirement, managing money, and more.