
Understanding support and resistance is one of the most important skills for anyone learning technical analysis. Whether you are a beginner trying to understand market trends or an experienced trader studying price patterns, support and resistance levels play a critical role in reading stock charts and making informed investment decisions.
These levels help investors identify potential buying and selling opportunities, understand market psychology, and anticipate possible price movements. Many traders and investors also rely on insights from a share market advisory to combine technical levels with deeper research before taking positions in the market.
In this article, we will explain support and resistance in simple terms, how they work, why they are important, and how investors can use them effectively while analyzing stocks.
What Is Support in the Stock Market?
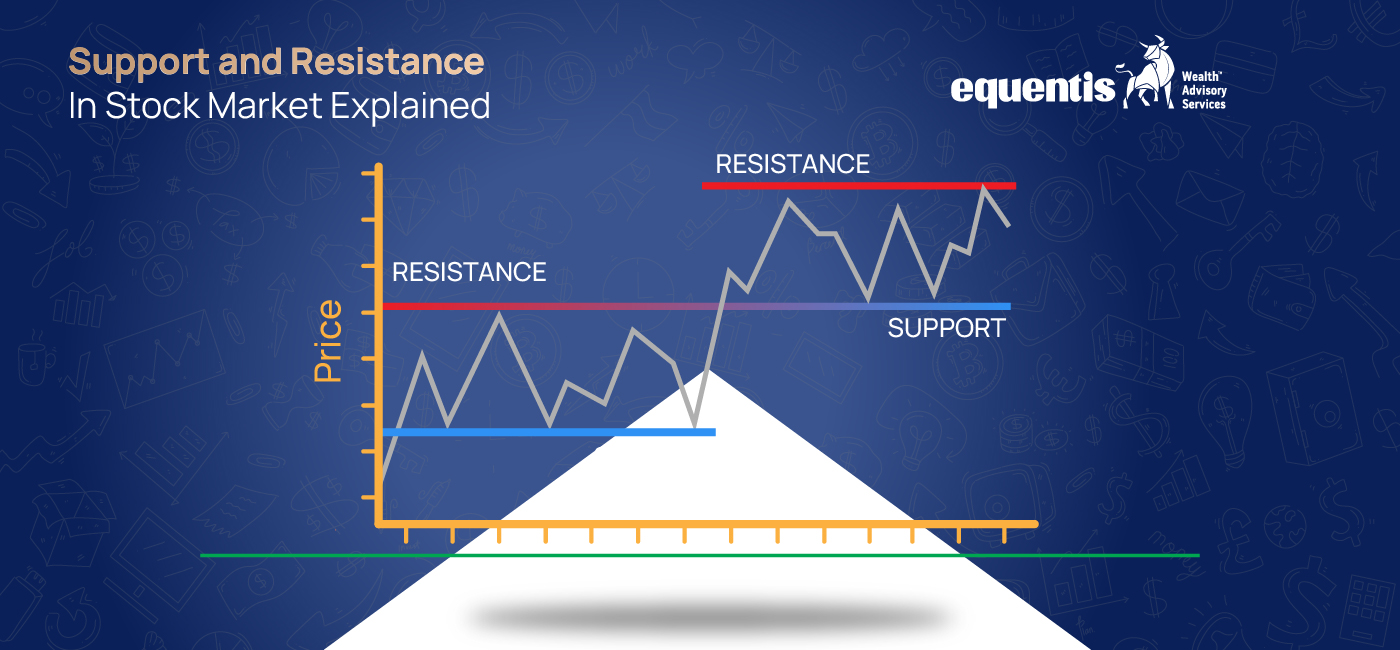
Support refers to a price level where a stock tends to stop falling and may start moving upward again. At this level, buying interest increases because investors believe the stock is undervalued.
When a stock approaches a support level, more buyers enter the market and demand increases. This often prevents the price from falling further.
For example, if a stock repeatedly stops falling around ₹500 and begins to rise from that level, ₹500 becomes a strong support level.
Key characteristics of support include:
- It acts as a price floor
- Buyers usually enter the market at this level
- Price often bounces upward from support
- Repeated tests make support stronger
Understanding support is an important step in reading stock charts because it helps investors identify possible entry points.
What Is Resistance in the Stock Market?
Resistance is the opposite of support. It refers to a price level where a stock tends to stop rising and may begin to decline.
At this level, selling pressure increases because investors believe the stock is fully valued or overvalued.
For instance, if a stock repeatedly struggles to move above ₹800 and falls after reaching that level, ₹800 becomes a resistance level.
Key characteristics of resistance include:
- It acts as a price ceiling
- Sellers become more active at this level
- Price often reverses downward from resistance
- Multiple tests strengthen the resistance level
Resistance levels help traders identify potential exit points or areas where the stock might face selling pressure.
Why Support and Resistance Are Important
Support and resistance are important because they reflect the psychology of the market. These levels represent areas where buyers and sellers have historically reacted strongly.
Investors use them for several reasons:
Identifying entry points
Support levels may indicate good buying opportunities when the price approaches a strong demand zone.
Planning exit strategies
Resistance levels can help investors decide when to book profits.
Understanding market trends
Breakouts above resistance or breakdowns below support often signal new trends.
Improving risk management
By placing stop losses near support or resistance levels, traders can control potential losses.
Many investors combine technical levels with research insights from a share market advisory to make better investment decisions.
How Support and Resistance Levels Are Formed
Support and resistance levels form due to repeated price reactions at specific levels. These reactions happen because of market psychology and trading behavior.
Several factors contribute to the formation of these levels:
Historical price levels
Stocks often react to price levels where they have previously reversed direction.
High trading volumes
Areas with significant trading activity can create strong support or resistance zones.
Psychological price levels
Round numbers such as ₹100, ₹500, or ₹1000 often act as psychological barriers.
Institutional activity
Large institutional buying or selling can establish strong price levels in the market.
Recognizing these factors can help investors improve their ability in reading stock charts.
Types of Support and Resistance
Support and resistance levels can appear in different forms depending on market conditions and chart patterns.
Horizontal Support and Resistance
This is the most common type. The price repeatedly reacts at a specific horizontal level.
For example, if a stock keeps bouncing around ₹300, that level becomes a horizontal support.
Trendline Support and Resistance
Trendlines connect multiple highs or lows on a chart and create dynamic support or resistance levels.
In an uptrend, the trendline acts as support. In a downtrend, it acts as resistance.
Moving Average Support and Resistance
Popular moving averages such as the 50-day or 200-day moving average often act as support or resistance levels.
Investors often watch these levels closely because they reflect longer-term trends.
Psychological Levels
Round numbers often attract strong buying or selling interest. For example, ₹1000 or ₹5000 can act as important price barriers.
Support Turning into Resistance and Vice Versa
One interesting aspect of support and resistance is that they can switch roles.
When a stock breaks below a support level, that level may later act as resistance. Similarly, when a stock breaks above resistance, that level may become support.
This phenomenon occurs because market participants remember previous price levels and adjust their trading behavior accordingly.
For investors learning reading stock charts, recognizing this shift is extremely valuable.
Breakouts and Breakdowns
Breakouts and breakdowns are important signals in technical analysis.
Breakout
A breakout happens when a stock moves above a resistance level with strong volume. This often indicates the start of a new upward trend.
Breakdown
A breakdown occurs when a stock falls below a support level. This may signal further downside movement.
Investors often watch these moments closely because they can indicate strong market momentum.
How Traders Use Support and Resistance
Traders use support and resistance in several ways when analyzing stocks.
Buying near support
Some investors buy when the stock approaches a strong support level.
Selling near resistance
Others may sell or book profits when the price nears resistance.
Trading breakouts
Many traders wait for a confirmed breakout above resistance before entering a trade.
Setting stop losses
Support and resistance levels are commonly used to place stop losses and manage risk.
These strategies become more effective when combined with proper research and insights from a share market advisory.
Common Mistakes When Using Support and Resistance
Although support and resistance are powerful tools, investors often make mistakes while using them.
Some common mistakes include:
- Treating support and resistance as exact numbers instead of zones
- Ignoring trading volume during breakouts
- Relying only on technical analysis without studying fundamentals
- Overtrading based on minor price movements
Avoiding these mistakes can help investors improve their technical analysis skills.
Final Thoughts
Support and resistance are fundamental concepts in technical analysis and play a crucial role in understanding market movements. These levels help investors identify potential entry and exit points, manage risk, and better understand market sentiment.
Learning reading stock charts and recognizing these levels can significantly improve trading decisions. However, technical analysis should always be combined with strong research and disciplined investing.
Many investors also rely on insights from a share market advisory to complement technical analysis with deeper market understanding. By combining both approaches, investors can develop a more balanced and informed investment strategy.
FAQs
1. What is support and resistance in the stock market?
Support and resistance are price levels where a stock tends to stop falling or rising due to increased buying or selling pressure.
2. Why are support and resistance important?
They help traders identify potential entry points, exit levels, and possible trend reversals.
3. How do traders identify support levels?
Support levels are usually identified by observing price areas where a stock repeatedly stops falling and begins to rise.
4. How do traders identify resistance levels?
Resistance levels appear where a stock repeatedly struggles to move higher and starts declining.
5. Can support become resistance?
Yes, when a stock breaks below a support level, that level can later act as resistance.
6. Can resistance become support?
Yes, once a stock breaks above resistance, that level often becomes a new support.
7. Are support and resistance exact numbers?
No, they are usually zones rather than exact price points.
8. What is a breakout in technical analysis?
A breakout occurs when a stock price moves above resistance with strong momentum and volume.
9. What is a breakdown in technical analysis?
A breakdown happens when a stock price falls below support and continues moving downward.
10. Do support and resistance work in all markets?
Yes, they can be applied to stocks, commodities, currencies, and other financial markets.
11. How does volume affect support and resistance?
High trading volume near these levels strengthens their reliability.
12. What role do psychological levels play in support and resistance?
Round numbers often act as strong price barriers because many traders place orders around them.
13. Can beginners learn support and resistance easily?
Yes, it is one of the most basic and widely used concepts in technical analysis.
14. What tools help identify support and resistance?
Trendlines, moving averages, and previous price levels are commonly used tools.
15. How important is reading stock charts in trading?
Reading stock charts helps investors understand price trends, patterns, and potential trading opportunities.
16. Do long term investors use support and resistance?
Yes, many long term investors use these levels to identify better entry points.
17. Is technical analysis enough for investing?
No, investors should combine technical analysis with fundamental research.
18. Can a share market advisory help with technical analysis?
Yes, a share market advisory often provides insights that combine research with technical analysis.
19. How often do support and resistance levels change?
They change as new price data forms and market conditions evolve.
20. Can support and resistance improve trading accuracy?
Yes, when used properly with other indicators, they can significantly improve trading decisions.
Disclaimer Note: The securities quoted, if any, are for illustration only and are not recommendatory. This article is for education purposes only and shall not be considered as a recommendation or investment advice by Equentis – Research & Ranking. We will not be liable for any losses that may occur. Investments in the securities market are subject to market risks. Read all the related documents carefully before investing. Registration granted by SEBI, membership of BASL & certification from NISM in no way guarantee the performance of the intermediary or provide any assurance of returns to investors.

Parvati Rai is the Vice President of the Research team at Equentis. She has over 15 years of equity-research and strategy-consulting experience. A specialist in deep-dive valuations, financial modelling, and forecasting, she has built research desks from the ground up, by steering buy-side, sell-side, and independent coverage across sectors. When she isn’t fine-tuning models, Parvati unwinds on nature treks and mentors aspiring analysts.