
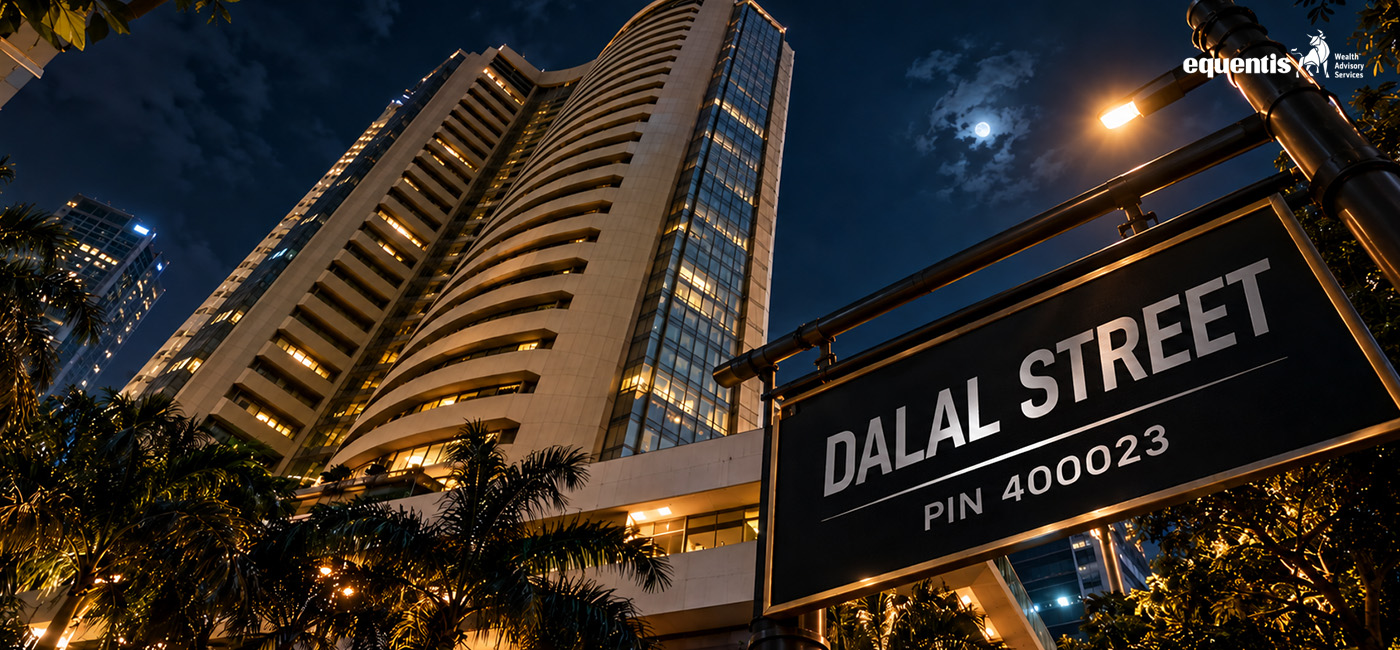

The Nifty 50 support zone of 23,125–23,225 has emerged as an important area to watch on Dalal Street after the index came under selling pressure. Market analyst Anil Singhvi identified this range as a key support zone, with the Nifty having fallen to around 23,231 during the session. The zone matters because a sustained hold could encourage buying interest, while a decisive breakdown below the lower end could indicate further weakness.
Why Is the 23,125–23,225 Zone Important?
Support is a price area where buying interest may emerge after an index declines. The 23,125–23,225 range is particularly important because it places the Nifty close to a recent three month low.
According to the market commentary, the Nifty 50 fell as much as 1% to 23,231.4, while the Sensex declined to 74,160.2. The fall reflected continued pressure across Indian equities and brought the Nifty close to the identified support range.
The key point for traders is that a support zone is not a guaranteed reversal point. Price action around the zone needs to be monitored for confirmation.
Nifty 50 Strategy: What Does 23,125–23,225 Mean?
The range can be viewed as a decision area rather than a single price.
The upper end, around 23,225, is the first level to observe when the index approaches the zone. If buying interest develops and the index moves back above this area, traders may look for signs of stabilisation.
The lower end, around 23,125, is more important from a risk perspective. A decisive break and sustained trading below this level would weaken the support structure and could increase selling pressure.
This approach is different from assuming that the index will automatically bounce from the zone. Technical levels work through market behaviour, and confirmation remains important.
What Are the Important Nifty 50 Levels to Track?
The broader technical picture suggests that traders should monitor both support and resistance levels rather than focusing on one number.
Recent market analysis had identified 23,180 as an important short term support, with 23,140, 23,100 and 23,030 below it. On the upside, 23,280 was identified as immediate resistance, followed by 23,330, 23,400 and 23,440.
This creates a relatively clear framework:
- 23,125–23,225: Major support zone highlighted by the market commentary
- 23,100: Nearby downside level
- 23,030: Further support if selling intensifies
- 23,280: Immediate resistance
- 23,330: Next level to watch on a recovery
- 23,400: Higher resistance area
- 23,440: Further upside hurdle
These levels can change as new price action develops, so they should be treated as a snapshot of the technical setup rather than permanent levels.
What Happens If Nifty Holds the Support Zone?
If the Nifty holds above the 23,125–23,225 area and begins forming higher lows, it could indicate that selling pressure is easing.
A move above 23,280 would provide an additional sign of short term strength according to recent technical commentary. A sustained move above 23,330 could strengthen the recovery structure further, while 23,400 and 23,440 would become subsequent areas to monitor.
However, traders should distinguish between a temporary intraday bounce and a broader trend reversal. A single positive session does not necessarily change the overall market structure.
What If Nifty Breaks Below 23,125?
A sustained breakdown below 23,125 would be an important development because it would mean the index has moved below the identified support zone.
Recent technical analysis has also highlighted 23,125 as a level below which downside momentum could accelerate. The next levels mentioned include 23,100 and 23,030.
For investors, this illustrates why support zones should not be treated as guaranteed floors. Market conditions can change quickly when selling pressure increases, particularly when global markets, crude oil, currency movements or institutional flows are unfavourable.
What Is Driving Volatility on Dalal Street?
The Nifty’s movement needs to be considered within the broader market environment.
Indian equities have recently faced pressure amid concerns around global interest rates, crude oil prices, the rupee and international risk sentiment. Higher crude prices can be particularly relevant for India because the country imports a large portion of its crude oil requirements.
For traders, these macroeconomic factors can sometimes override individual technical levels. That is why support and resistance analysis works better when combined with volume, market breadth and global cues.
What Should Retail Investors Watch?
Retail investors tracking the Nifty 50 today should avoid treating a technical support level as an instruction to enter a trade.
Instead, the 23,125–23,225 zone can be used as a reference point for assessing market behaviour. Important signals include whether the index holds the range, whether trading volume increases during a rebound, and whether resistance levels are subsequently reclaimed.
Investors with longer time horizons may also want to focus on corporate earnings, valuations, economic growth and portfolio allocation rather than reacting to every intraday movement.
Opportunities and Risks
The main positive technical scenario would involve the Nifty defending the 23,125–23,225 support area and subsequently reclaiming resistance levels such as 23,280 and 23,330.
The risk is a decisive breakdown below support. Such a move could indicate that sellers remain in control and bring lower levels into focus.
There is also a risk of a false breakout or breakdown. The index could briefly move above or below a level before reversing, which is why confirmation through price action and, where relevant, volume can be useful.
Conclusion
The 23,125–23,225 Nifty 50 support zone is an important technical area highlighted by market analyst Anil Singhvi following a sharp decline in the index. Holding this zone could provide a base for stabilisation, while a sustained breakdown below 23,125 would weaken the technical setup.
For Dalal Street participants, the next important levels include 23,280 and 23,330 on the upside, while 23,100 and 23,030 are relevant on the downside. The broader market trend, global cues and fresh price action will determine whether these levels hold significance in subsequent sessions.
Frequently Asked Questions
1. What is the Nifty 50 support level at 23,125–23,225?
The 23,125–23,225 range is a support zone highlighted in market commentary by Anil Singhvi. It represents an area where buying interest could emerge after the recent decline. However, support is a technical reference rather than a guaranteed reversal point, and traders generally look for confirmation from subsequent price action.
2. Why is 23,125 important for Nifty 50?
The 23,125 level represents the lower end of the highlighted support zone. A sustained move below this level would weaken the support structure and could bring lower levels into focus. Recent technical analysis also identified 23,125 as a level where a breakdown could increase downside momentum.
3. Is 23,125–23,225 a guaranteed buying opportunity?
No. The phrase “buy area” describes a technical view, not a guaranteed investment opportunity. Market conditions can change quickly, and an index can move below a support zone. Investors should consider their timeframe, risk tolerance and broader market conditions rather than relying on one technical level.
4. What are the immediate resistance levels for Nifty 50?
Recent technical commentary identified 23,280 as an immediate resistance level, followed by 23,330, 23,400 and 23,440. A sustained move through these levels could indicate improving short term momentum, although resistance levels can change as new price data becomes available.
5. What happens if Nifty 50 breaks below 23,125?
A sustained break below 23,125 would indicate that the identified support zone has weakened. Technical levels around 23,100 and 23,030 could then become relevant. Traders generally distinguish between a temporary intraday move below support and a sustained breakdown confirmed by subsequent price action.
6. What happens if Nifty 50 holds 23,125–23,225?
If the Nifty holds this range and develops stronger buying interest, traders may watch whether it can reclaim resistance around 23,280 and 23,330. A rebound from support does not automatically confirm a broader trend reversal, so follow through in subsequent sessions remains important.
7. What is the Nifty 50 trading strategy around support levels?
A common technical approach is to monitor how price behaves around support rather than acting solely because the index reaches that level. Traders may look for confirmation such as a sustained hold, reversal pattern, improving market breadth or increased participation before determining their strategy.
8. Why is the Nifty 50 important for Indian investors?
The Nifty 50 tracks 50 major companies listed on the National Stock Exchange and is widely used as a benchmark for Indian equities. Its movement provides a broad indication of market sentiment, although individual stocks and sectors can perform differently from the index.
9. Can global markets affect Nifty 50 support levels?
Yes. Global equity markets, crude oil prices, interest rate expectations, currency movements and foreign institutional flows can influence Indian equities. Strong external selling pressure can cause domestic indices to break technical support levels, while favourable global cues can support recoveries.
10. What should investors watch next on Dalal Street?
Investors should monitor Nifty’s behaviour around 23,125–23,225, along with resistance near 23,280 and 23,330. Beyond technical levels, earnings, market breadth, institutional flows, crude oil prices, the rupee and global market cues can influence the index’s direction. Technical levels should therefore be considered alongside broader market information.
Disclaimer Note: The securities quoted, if any, are for illustration only and are not recommendatory. This article is for education purposes only and shall not be considered as a recommendation or investment advice by Equentis. We will not be liable for any losses that may occur. Investments in the securities market are subject to market risks. Read all the related documents carefully before investing. Registration granted by SEBI, membership of BASL & certification from NISM in no way guarantee the performance of the intermediary or provide any assurance of returns to investors.

Parvati Rai is the Vice President of the Research team at Equentis. She has over 15 years of equity-research and strategy-consulting experience. A specialist in deep-dive valuations, financial modelling, and forecasting, she has built research desks from the ground up, by steering buy-side, sell-side, and independent coverage across sectors. When she isn’t fine-tuning models, Parvati unwinds on nature treks and mentors aspiring analysts.