Fundamental Analysis of Stocks

Fundamental analysis of stocks based on the quarterly and annual reports of the companies.

Once a dominant player, Vodafone Idea is now struggling to stay afloat. With mounting debt, falling subscriber numbers, and weak financial position, the telecom company is in a dire state.

However, with the support of the promoter and the government, will Vodafone Idea be able to make a turnaround? What does the future of Vodafone Idea share price hold? 

We will do a deep dive analysis of the company. Stay tuned till the end.

Performance of Vodafone Idea Share Price 

Over the last year, Vodafone Idea share price has largely remained range-bound, trading below the ₹10 level. The company has a market capitalization of nearly ₹78,000 crore, as of 25th July 2025.

The 52-week high and low for Vodafone Idea are ₹16.6 and ₹6.29, respectively. 

AD 4nXfM1XSWXXdfpVjudQ8RdixCDxbigTWPgmV6QVAQ0gmxV5llHlZEiwQNgwKwX4 Rf3VkGi407pvzVoX21u6tDKq3 ojWAK g5Lo7FtbAtehtm6SHaam6rp8GY Y26OeiOUdXmRTOAQ

News flows like fundraising plans, tariff hike talks, and government intervention are the major causes of volatility in Vodafone Idea share price. Further, due to poor financials, institutional investors avoid the stock, leaving retail investors and traders as the dominant participants. 

Fundamental Challenges for Vodafone Idea 

Subscriber Loss

While Bharti Airtel and Reliance Jio have increased their subscriber base, Vodafone Idea’s subscriber base is not improving. Its market share has slipped below 15%, raising concern about its long-term viability and competitive edge. 

At the end of June 2025, Vodafone Idea had a total subscriber base of 198 million, while Reliance Jio and Bharti Airtel had 494.47 million and 302.15 million subscribers, respectively. 

Huge Debt Burden

Vodafone Idea is one of the most indebted telecom companies globally. 

As of 31st March 2025, the outstanding debt from the bank stood at ₹2,345 crores. In FY26, dues related to spectrum are ₹2,538 crores, and the AGR instalment is ₹16,428 crores. 

The annual interest cost exceeded ₹25,530 crores in FY25, leaving little room for capex and spending on network expansion.

Weak ARPU and Revenue Growth

Vodafone Idea’s Average Revenue Per User (ARPU) is well below its peers. At the end of Q4FY25, customer ARPU stood at ₹175, while Airtel and Jio’s ARPU were ₹245 and ₹209, respectively. 

The primary causes of lower ARPU are the lower monetization of the user base, reliance on low-paying prepaid users, and the inability to retain premium customers. 

In FY25, the company’s revenue from operations stood at ₹43,571 crore, reporting a slight growth of 2.1% from ₹42,652 crore in FY24. 

AD 4nXdBTzTjlP ufSywyGoRzK mcBRyDvl4vzPDNMqrsC I0YSvXz

Limited Capex and Network Investment

Telecom is a capex-heavy business. A telecom operator’s strength lies in its network, and Vodafone Idea is significantly underinvested compared to peers. 

The following are the capex figures of all three telecom operators in FY25:

  • Reliance Jio: ₹41,600 crores
  • Bharti Airtel: ₹30,300 crores
  • Vodafone Idea: ₹9,570 crores 

Additionally, both Reliance Jio and Bharti Airtel have nearly completed the nationwide rollout of 5G services. While Vodafone Idea’s 5G services are limited to a few cities. Work is underway to roll out the services in 17 circles by August 2025. India currently has 22 telecom circles. 

The company has missed an opportunity to retain or regain premium customers. Now, both Reliance Jio and Bharti Airtel will reduce their 5G-related capex spending in FY26. 

Negative Cash Flow and Operational Stress

While the company has been successful in improving its operational profit and margin, the huge interest expense, license fee, and capex outgoes still result in negative cash flow. 

AD 4nXceF Hzjs4g3 zsCny fgMjwdHJ 8JwBA3ZQvZtpiCoXZnQ08aiONZleRGBa jrs ikkSekgypIn4U4dAIr3VKQWoShoAQS9or b0zcoqJcC0P5wiNhd8Z3LSabkkfzierCYwA9Yg

Compared to peers, Vodafone Idea has much lower operating margin. In FY25, the EBITDA margin of Bharti Airtel and Reliance Jio are 57.8% and 50% respectively. The number indicates operational stress or due to outflow of subscribers, Vodafone Idea is struggling. 

Vendors, such as Indus Towers, have on multiple occasions also flagged delays in payments.

Corporate Governance & Promoter Support Issues

After converting AGR dues to equity, the Government of India has become a majority shareholder in Vodafone Idea. Although, Government of India is the largest shareholder, it is not a proactive investor. 

This has led to promoters’ reduced commitment towards the organisation. While Aditya Birla Group has infused more than ₹2,000 crores in the company, it came after much hesitation. 

AD 4nXf4gYFqOggE5jo53YsZJll3VNxN LpFiudPidnzj6omV3F WWZ

The fundraising has failed multiple times, and Vodafone Idea has to depend on external sources and borrowings to meet its capex spend. 

Vodafone Idea is facing a deep structural crisis, and it requires serious investors with long-term commitments. 

Investor Takeaway: Should You Invest in Vodafone Idea?

Vodafone Idea remains a financially fragile company, operationally behind its peers, and strategically vulnerable. The company has to depend on constant government relief packages, borrower, and promoter support to keep it operationally afloat. 

The recent quarterly performance has indicated some positive developments, like improvement in EBITDA, improved 4G performance by adding network base stations, and starting of 5G deployment. This has resulted in reduced subscriber loss. 

Currently, the company lacks revenue and profit growth visibility, with no major catalyst like mergers, major fundraising, or technical collaboration. 

While a successful turnaround could lead to multibagger returns from current levels, the probability remains low without credible capital infusion from promoters and clear strategy. 

FAQ

Is Vodafone Idea a profitable company?

No, Vodafone Idea is not a profitable company. However, it is making profits on an operational level.

Why does the Vodafone Idea share price fluctuate so much?

Vodafone Idea share price is highly sensitive to news such as funding announcements, tariff hikes, and government decisions. Since the company has weak fundamentals, it is often driven by sentiment, making it volatile and speculative. 

How much stake does the Government of India hold in Vodafone Idea?

As of June 2025, the Government of India has 49% stake in Vodafone Idea, making it the largest shareholder. Despite having the highest stake, it is not the promoter of the company.

JSW Steel has become India’s largest steel manufacturer by market capitalization, overtaking Tata Steel. While other steel manufacturers are facing operational challenges, global headwinds, JSW Steel continues to expand its footprint, both in India and overseas, through aggressive brownfield expansions and capacity additions at existing plants.

In this article, we will take a closer look at JSW Steel share price performance, operational strength, and the long-term growth outlook. Let’s dive in. 

JSW Steel Business Overview

JSW Steel is one of India’s largest integrated steel manufacturers. Founded in 1994, it has grown into a global player with exports to 100+ countries.

The annual steel production capacity is 38.5 million tonnes with its six operational plants in India and the US. 

In India, it has plants in Vijaynagar, Dovi, Salem, Tarapur, Vasind, and Kamleshwar. The Vijaynagar plant is India’s biggest single-location steel plant. 

It has a diverse product portfolio, including flat products, long & special steel, and value-added steel products (VASP), which contribute nearly 60% of the sales. 

The company is recognized for its innovative products. It has a technological partnership with JFE Steel of Japan for the manufacturing of high-strength automotive wheels. And has also won many accolades for its sustainability efforts. 

JSW Steel is recognised as a 2025 Sustainability Champion by the World Steel Association for the 7th consecutive year.

JSW Steel Leadership Team

Mr Sajjan Jindal is the Chairman and Managing Director of JSW Steel and also the principal promoter of the company

Mr Jayant Acharya is the Joint Managing Director and CEO. He started his career in the year 1986 with SAIL. With over three decades of experience in the metal & mining industry, Mr Acharya played a key role in the growth of JSW Steel. He holds a Bachelor’s degree in Chemical Engineering, a Master’s degree in Physics from BITS Pilani, and an MBA degree. 

Mr Gajraj Singh Rathore is the Whole‑Time Director & COO of the company. He has over 35 years of experience in the steel industry and has been with JSW Steel for the past 27 years. He played a key role in the successful expansion and capacity utilization at Vijaynagar and other steel plants. 

Mr Arun Sitaram Maheshwari is the Director (Commercial & Marketing) of JSW Steel and has been with the company for over 28 years. During his tenure, he played a key role in the sourcing of raw materials for the steel and power businesses, shaping corporate strategy, and international presence. Mr Arun holds a B.Com and an MBA degree. 

Mr Swayam Saurabh is the CFO and has been with the company since July 2023. A chartered accountant by profession, Mr Swayam was earlier associated with companies like Arvind, Ola, Hindustan Zinc, Philips, etc. 

JSW Steel Shareholding Pattern

AD 4nXehWC1eW 2PbTdaFNuVJt9ovOGHOrtl19wbH2ja1vTQRFB1VyiPkbdm0kkczdE4U4rTuj9YIVPhjntmVVRz0e1ZzI0HmRu1qEVfDbQgJ4c05 3Eza3IWsZS3hHg3Nk5mf92 MG qg

In the domestic institution segment, mutual funds hold a 3.54% stake in JSW Steel, and LIC holds a 6.45% stake. 

And, in the foreign institution segment, JFE Steel International Europe B.V., the technological partner of JSW Steel, holds a 15% stake in the company. 

JSW Steel Financials

Revenue From Operations

In FY25, the company’s revenue from operations declined by 3.5% year-on-year to ₹1,68,824 crores.

The decline in revenue came despite 6.7% year-on-year growth in sales volume. Globally, steel prices have moderated, which has affected the top-line growth of many steel companies. 

AD 4nXeDUL

In Q1FY26, the company’s revenue from operations increased marginally to ₹43,147 crores from ₹42,943 crores. Total sales volumes during the quarter were at 6.69 MT, up 9% YoY. 

EBITDA

In FY25, EBITDA declined by 19% on a year-on-year basis to ₹22,904 crores from ₹28,236 crores. The decline in EBITDA is due to lower sales realisation on account of moderate steel prices and lower EBITDA from Bhushan Power & Steel. 

For the Q1FY26 period, EBITDA improved 37.5% to ₹7,576 crores from ₹5,510 crores in Q1FY25. This is due to lower raw material costs and a higher share of premium products in total sales. 

AD 4nXcWeaXr6hFNrBXDh1cnWDkgiUjMjskkWEP7OxFRxeIFGUtx9g891nTUCY NEotOz3Q2WqBO6o0C
AD 4nXfkvOi0CYY2GEmG0iLwsHArHkPhwqfab8l1m7BaX BZOaLjJBoeZT1ZmOjDCAj73ghg2opO59 MPDTiVLDnLIYTrzlIRCMfKXGxAPRvBoxjegDSdDgkxj l99gs4HuNpe7Ikytd

Net Profit

In FY25, the net profit of JSW Steel declined by more than 60% year-on-year to ₹3,491 crores from ₹8,973 crores in FY24. 

For Q1FY26, the net profit of the company increased by 154% on a year-on-year basis to ₹2,209 crores from ₹867 crores in Q1FY25. 

AD 4nXevp5Lq7910SR61C gk4JcUIav2bGp3Ni71UwaOEO3L08oAVkViht0au7BFBXCis1jsmvheTQ3aNgj5GZELDGWgHe8DKirNQv5lMaNvilY1tmvDtaSL1d1334AjrCJDW dwApc9

Key Financial Metrics 

Current Ratio: In FY25, the current ratio of JSW Steel improved 22% to 1.06 times from 0.87 times in FY24. The increase is primarily due to an increase in cash and cash equivalents, investments in mutual funds, and lower trade payables. 

Debt-to-equity Ratio: Due to higher borrowing, the debt-to-equity ratio of the company increased to 0.82 times in FY25 from 0.78 times in FY24. 

Debt Service Coverage Ratio: In FY25, the debt service coverage ratio of the company declined by 20.7% to 2.42 times from 3.05 times in FY24. The decline is primarily due to lower profits during the financial year. 

Return on Capital Employed (ROCE): The ROCE of the company declined to 8.59% in FY25 from 12.90% in FY24, primarily due to decreased profit levels. 

JSW Steel Share Price Analysis

In the last five years, JSW Steel share price has increased from ₹205 (21st July 2025) to ₹1,031 (23rd July 2025), a rise of almost 405% in 5 years. Its 52-week high level is ₹1,075. 

AD 4nXdMdCL J60uJ98wqeKZS5 AbPa30oxDlDXceyRADXwkxj2PlZnES ZhP0NaurbAznr3dq ZapILyLy33 kyJyG7HzBw

It has a consistent track record of paying dividends to shareholders. In the last three financial years, it has paid ₹3.40 (FY23), ₹7.30 (FY24), and ₹2.80 (FY25) as dividends. 

At the current JSW Steel share price of ₹1,031, the dividend yield stands at 0.27%.

JSW Steel Share Price: Future Growth Potential 

The steel industry is cyclical, meaning its performance is directly dependent on the state of the economy. When economic growth slows, demand for steel drops, making it tough for businesses. 

Because of this, companies like JSW Steel see high variations in revenue and profit growth. Their valuation tends to stay low, with modest P/E, due to the unpredictability in earnings. 

Generally, cyclical stocks are best bought when they’re out of favor and sold when businesses boom. As the economy recovers and demand picks up, these stocks usually rally. After 2020, we have seen a strong rally in commodity stocks, including steel. 

But mis-timing your entry can hurt your returns. Buying during peak performance leaves little room for upside.

Positives for JSW Steel Share Price

  • Favorable cost dynamics. The price of both key raw materials, coking coal and iron ore, is expected to remain soft, helping to improve cost efficiencies. 
  • Volumes are expected to improve in Q2FY26, as planned plant shutdowns are expected to conclude. And, the addition of new capacities coming on-stream. 
  • Increasing the share of securing raw materials from captive sources: In FY26, the management expected the company to meet 40% of its iron ore requirement from its sources, up from 37% in FY25. For coking coal, the company doesn’t possess any captive mines as of now. But expects production from the Moitra mine (captive) to commence from June 2026. High captive share is essential for both quality, control over steel prices, and earnings stability. 

Negatives for JSW Steel Share Price

  • The global economy is experiencing a period of volatility, influenced by tariff escalations and ongoing geopolitical tensions. This uncertainty has led the IMF to lower its 2025 global forecast.
  • A sharp revival in Chinese steel demand is a major cause of concern, leading to depressed domestic steel prices. Also, FTAs with Vietnam, Korea, and Japan continue to pose a risk.
  • While management expects coking coal prices to remain lower, volatility in iron ore prices can impact margins.
  • Legal uncertainty surrounds Bhushan Power & Steel Ltd’s acquisition. The Supreme Court has rejected JSW Steel’s resolution plan for BPSL and has directed refunds of amounts paid to creditors and equity contributions.

Driven by volume growth, a higher share of premium products in revenue, and shoring up its captive sources, JSW Steel offers a compelling growth story. However, the cyclical nature of the industry should be considered before investing in JSW Steel. 

FAQ

How has JSW Steel share price performed in the last five years?

JSW Steel has been a multibagger stock in the last five years. JSW Steel share price increased from  ₹205 (21st July 2025) to ₹1,031 (23rd July 2025), a rise of almost 405% in 5 years.

Who owns JSW Steel?

JSW Group owns JSW Steel and is headed by Mr. Sajjan Jindal.

Is JSW Steel profitable?

Yes, JSW Steel is a profitable steel manufacturer. In FY25, its net profit was ₹3,491 crores on sales of ₹168,824 crores. 

Since 2024, Larsen & Toubro share price is moving sideways with no real wealth creation for investors. 

But, if you look at the company’s operational performance, revenue and profitability growth has been healthy during the period. 

So, why is Larsen & Toubro share price struggling to move higher despite a strong operational performance? 

We will do a deep dive analysis of Larsen & Toubro share price, what is impacting its performance, and the future growth outlook of the company.

Larsen & Toubro Business Overview

Larsen & Toubro (L&T) is one of India’s most respected multinational conglomerates, headquartered in Mumbai. Founded in 1938 by Danish engineers Henning Holck-Larsen and Søren Kristian Toubro, the company is a diversified engineering and infrastructure giant. 

It operates in key sectors like construction, engineering, heavy equipment manufacturing, defense, information technology (through subsidiaries like L&T Infotech and L&T Technology Services), financial services, energy, and power. 

L&T has now expanded its operations to more than 30 countries, with more than 50% revenue now coming from outside India. The company plays a critical role in India’s development journey and is widely regarded as a benchmark in project execution and engineering excellence. 

L&T Leadership Team

Mr. S. N. Subrahmanyan is the Chairman & Managing Director and has been with L&T since 1984, joining as a Project Planning Engineer. Under his leadership, the company has completed many key infrastructure projects, including the Statue of Unity, Atal Setu, K9 Vajra Tank, Ayodhya Ram Mandir, and has geographically expanded the company. Mr. Subrahmanyan did his B.Tech in civil engineering from NIT Kurukshetra, a postgraduate degree in business management from Symbiosis Institute of Business Management, Pune, and also did an Executive Management Program from London Business School. 

Mr. Subramanian Sarma is the Deputy Managing Director & President of L&T Group. He oversees the energy portfolio of the company, which comprises hydrocarbons, green & clean energy, asset management & offshore wind business. Mr. Sarma is a chemical engineering graduate and did his master’s from IIT Mumbai. 

Mr. R. Shankar Raman is the President and Chief Financial Officer of L&T. He joined the L&T group in 1994 and played a key role in setting up L&T Finance. A qualified Chartered Accountant and a Cost Accountant, Mr Raman is responsible for the entire finance function at the group level.

L&T Shareholding Pattern

AD 4nXeBSlQh9 2qvnlOq3IZGbQH3jAGcI7tKkvCBoiGfzn Pc36LDmEGyfDuckOxR2Ap dPbgrZhce93vV0SQQMd88MhMaRweJvQIeEgxIG R 5rk2fmWAcrRCpTk8dCd9APWgaedPpnQ

L&T is a professionally managed company with 100% shareholding held by the public. Nearly 20% of the stake is held by mutual fund houses in India, and LIC holds a 13.25% stake in the company. 

Larsen & Toubro Financials

Revenue From Operations

In FY25, L&T’s revenue from operations increased by 16% to ₹2.55 lakh crore from ₹2.21 lakh crore in FY24. 

Over the last five years, revenue from operations has increased by 13.47% annually.

AD 4nXff3GQ19iG5kWIHa0wogfVVMqPrKc zDL8VqhNYXYCVg76z2De NGhDeYcBVe0f7dOuAFQroiSYClJs 1 Y srg1BPUTDfGX3jNq9ZDLuogVkVCXLPpExc UkA4Pe av86uj5ZpaQ

Speaking about the revenue composition, the company earns a lion’s share, i.e., 51% of its revenue from the infrastructure segment, followed by 26% from the services segment and 16% from the energy segment. 

AD 4nXfy3KXYqkJO7g5aTfL A6 UiAChk5AZybV5ZPYgSvDWKZ8dOOqiHZjkpg8DA8WhXoZom7W6ZSy uqF7j1hN u3YEHoSNc6Kac ock7CsmbUIZz bPIs32s Wbg5pmES3QcNWXe7jw

Source: Company Presentation

Looking at the geographical distribution of revenue, nearly 50% of the revenue is earned in India, 31% came from the Middle East, 16% from USA & Europe, and 3% from the rest of the World.

EBITDA

L&T’s EBITDA increased by 13% year-on-year to ₹26,435 crores in FY25, from ₹23,494 crores in FY24. 

AD 4nXexy yuz2UwXTrHubEcxKRHKzF8QF58lXY5V4q7sItNBk4mr0uIdDK7rijyMElXVtMeImCuVa3NpV3KNAADwJIKN01gxqF8vWygr4FiH59024bH1llMpF fHT4q a4wibCse0Tagg

Looking at the trend of EBITDA margin, it is on a slight declining trend. The margin has declined from 11.49% in FY21 to 10.34% in FY25, a fall of 105 basis points. 

Falling EBITDA margin also indicates increased competition in verticals it operates, and the company is sacrificing its profitability to win orders.

AD 4nXd10IeeBdPP5X ZQcJTVSEejIGjLgQCPmMEo0cABQxmQFNNGXeDDZywqy1MfkNZNxsHQG42nGk yZtldTN4f5s5YhflLotC6qfBu0o8dUyf7Q2EwEalHNacB3DlJKpiYxIoLDX Q

Net Profit

Barring FY22, the net profit of L&T has been consistently rising over the five-year period. In FY25, the net profit increased 13.7% to ₹17,673 crores from ₹15,547 crores in FY24. 

AD 4nXeaaNd4bFjLAQx1wZPbCAnSDFw6AT8myoJZZGTsyHU8fmzhthqXBFGJC95al0eXAgbUbYajDbGZYbU0jMPvKWolW SnvkGehrJIK5 OQHuYIWlpPXUB0 PEEdDn4Bb AUvXT1bVtQ

Key Financial Metrics

Debt-equity Ratio: At the end of FY25, the company’s debt-to-equity improved by 12.7% to 0.31 times from 0.35 times in FY24. 

Debt Service Coverage Ratio: The company’s ability to service debt has improved significantly in FY25, improving to 2.14 times from 1.84 times in FY24. 

Return on Equity: The ROE measures the returns on shareholders capital. It has recovered much of fall since 2022. In FY25, ROE improved to 15.94%, from 13.71% in FY24, due to increased profits.

FY21FY22FY23FY24FY25
ROE (%) 20.512.211.313.7115.94

Return on Capital Employed: The ROCE, which measures the returns on total capital employed (shareholders’ capital + debt), also improved to 13.45% in FY25 from 12.25% in FY24. 

Larsen & Toubro Share Price Analysis

Over the last five years, Larsen & Toubro share price has become a multi-bagger, rising from around the ₹900 level in July 2020 to currently trading at the ₹3,480 level (15th July 2025). 

However, if you look, the Larsen & Toubro share price has been trading sideways since 2024.

AD 4nXf0AY8Q7JhX4oOByMeZwJr0gHgzfwVcAR8ApxZ2ylettMfX rd R55sTUYZgRA38EFxnm2t faJDHhYTYa2YevJ6EkugwE2JPeyadP 61yzfJs K1QMB2oEZMJQZSnobCb0PND4oA

Larsen & Toubro has a consistent track record of paying dividends. In the last three financial years, the company paid ₹24 (FY23), ₹34 (FY24), and ₹34 (FY25) as dividends to shareholders. 

At the current price of ₹3,497, the dividend yield comes to 0.97%. 

Larsen & Toubro Share Price Valuation Metrics

Earning Per Share (EPS)

Over the last five years, the EPS of the company has improved, but not significantly. After a decline in FY22, it has been rising. The company has added only ₹27 to its EPS over the five-year period, explaining the sideways performance in the Larsen & Toubro share price. 

FY21FY22FY23FY24FY25
EPS (₹) 82.4961.7174.5193.96109.36

Price-to-Book Value (P/B Ratio)

As of 15th July 2025, the book value of Larsen & Toubro is ₹710 and is trading at a Price-to-Book value of 4.9 times. 

The 5-year median price-to-book value is 3.7 times, largely indicating the stock is trading at a sight premium compared to its historical valuation. 

AD 4nXffypomOJ3W7ReteWEYrWsvaXSB 0gDusza2azfbAU4gmxwZ74rJlJODLajkGCL8tYESwo xilaoHgTzOV mCndZwdBDF5XT

Source: Screener

Price-to-Equity Ratio (PE Ratio)

L&T stock is trading at a PE of 31.5 times, meaning, for every ₹1 of earnings, you are paying ₹31.5 as a premium. 

The median 5-Year PE is 30.8 times, indicating the Larsen & Toubro share price is trading at a fair valuation compared to its historical valuation. 

AD 4nXctSSrq54tkRs0yp hKKn7Kp6YLhXE4SwRMX 5zzeTwMNUKMvi NcjcBOO0HYOCyPm0f0okfkQ4YwcEo yzMWF5 clkiWhmMefjGi46YRKGj

Source: Screener

Larsen & Toubro Share Price: Future Growth Potential

Order Inflows

During the year, the company posted a record order inflow of ₹3.57 lakh crore, up by 18% on a year-on-year basis. 

This resulted in a total order book of ₹5.8 lakh crore in FY25, up from ₹4.76 lakh crore in FY24. With a strong order book, it gives a multi-year revenue visibility. 

AD 4nXfACeJxfw0Wf2fjhSbvyCwH2aAdb3NqMURpmMwV0sJPclhR76ZtkHulJ36zXoZB662daj4I IWm7 PTF3szDSJ73GVLsGuG9XYBc9OP1 jFBsrVFU4opQdTkJ92ESMKYkERyYrmSQ

Strategic Growth Initiatives

The company has expanded its presence in the Hydrocarbons, CarbonLite, Green, and Clean Energy sectors. Out of the total order book of ₹5.8 lakh crore, ₹1.4 lakh crore is in the Hydrocarbon segment, which the company is focusing on as its next growth drivers. 

Regarding the order book distribution, approximately 46% is International, with a significant portion from the Middle East. 

It is also focusing on new growth drivers in Renewables, Green Hydrogen, and Offshore Wind. L&T is also stepping up its capital allocation into green energy, data centres, and semiconductor design. 

FY26 Guidance

Larsen & Toubro’s management has provided the following guidance for FY26:

  • Group order inflows are expected to grow by 10% for FY26.
  • Group revenues are expected to grow by 15% for FY26.
  • The target margin for the Projects and Manufacturing portfolio is 8.5% for FY26.
  • The Net Working Capital to Revenue guidance for March 2026 is 12%.
  • The company expects that the revenue and margin targets set for FY26 will become more visible in the second half of FY26.

Risks and Challenges

Global Macro Uncertainty: Marked by continuing trade and military conflicts, corrosion of globalization, disruption in the supply chain, and higher financial market volatility.

Subdued Growth in Services Segment: The IT and Technology Services business is reporting subdued growth, reflecting the global macroeconomic environment impacting spending across the developed world.

Competition in Domestic Market: L&T is facing high competition in the domestic market, resulting in L&T being selective in its domestic order acquisition, especially in sectors like Water and Thermal Power.

Oil Price Volatility Impact on Hydrocarbon Projects: While most international infrastructure projects are not sensitive to oil prices, the Hydrocarbon business (about 60% of international order prospects) could see delays if oil prices fall drastically. 

Localization Requirements in the Middle East: As L&T grows in the Middle East, there is an aspiration for local participation, which necessitates investments in ramping up capacity and engaging local contractors. This could impact margins as L&T needs to factor in these costs.

FAQ

How has Larsen & Toubro share price performed over the last five years?

Larsen & Toubro share price has become a multibagger over the last five years, rising from around ₹900 level in July 2021 to currently trading at ₹3,480 level (15th July 2025). 

What does Larsen & Toubro do?

Larsen & Toubro is an infrastructure development company offering engineering, construction, technology, and manufacturing for its customers.

Who are the promoters of Larsen & Toubro?

Larsen & Toubro is a professionally managed company with 100% shares held by the public. 

India’s largest carmaker Maruti Suzuki is gearing up for a major portfolio transformation with the upcoming launch of its first electric vehicle (EV), the e-Vitara, expected in the first half of FY26.

This marks a pivotal moment for India’s leading carmaker. Can Maruti replicate the dominance it enjoys in the ICE (internal combustion engine) segment in the fast-evolving EV space? That’s the question on every investor’s and analyst’s mind.

In this article, we dive deep into Maruti share price performance, long-term business outlook, and how the EV shift could impact its share price.

Maruti Suzuki Business Overview

Maruti Suzuki is a wholly owned subsidiary of Suzuki Motor Corporation of Japan. Originally, it was established as a joint venture between the Government of India and Suzuki Motor Corporation. It is the largest passenger vehicle manufacturer in India, with a market share of 40% as of FY25. 

The company operates two manufacturing plants in Gurgaon and Manesar (Haryana), with a combined annual capacity of 2 million units. Additionally, with its contract manufacturing plant, Suzuki Motor Gujarat (SMG), adds further capacity for exports and domestic demand. 

Maruti Suzuki has divided its sales channel into four segments:

  • Nexa: It provides a premium sales experience targeted at new customer segments, offering a global buying experience, innovative technology, and enhanced hospitality. 
  • Arena: A youthful and modern destination that offers sub-premium segment cars to customers.
  • Commercial: It’s an automobile retail channel for light commercial vehicles.
  • True Value: It’s a destination for the sale and purchase of pre-owned cars at fair and transparent prices. 

The company has a distribution network of over 4,440 sales outlets, with over 4,964 service touchpoints. 

Maruti Suzuki Management Team

Mr. R. C. Bhargava is the Chairman of Maruti Suzuki and is responsible for stakeholder relationships, corporate social responsibility, and risk management. He has been with the company since its inception. Mr. Bhargava began his career as an IAS officer, and his first appointment was as Joint Secretary in the Government of India’s Ministry of Energy. 

Mr. Hisashi Takeuchi is the Managing Director & CEO and has joined the parent company, Suzuki Motor Corporation (SMC) in 1986. He has graduated from the Faculty of Economics, Yokohama National University. 

Mr. Kenichi Ayukawa has been the Director of Maruti Suzuki since July 2008 and also served as a member of the Board. A law graduate from Osaka University, Japan, Mr Ayukawa joined Suzuki Motor Corporation in 1980. 

Mr. Sunil Kakkar is the Director (Corporate Planning) and is a seasoned professional with over 35 years of experience at the company. He spearheaded many ambitious goals, helping to make the organization more agile and future-ready. Mr. Kakkar is an engineering graduate from IIT Kanpur and did his MBA from the Asian Institute of Technology. 

Mr. Arnab Roy is the Chief Financial Officer and has been with the company since October 2023. He is a seasoned professional with over 27 years of experience working with US, French, and British multinational corporations. His earlier assignment was with Schneider as the CFO of the Greater India Region’s Zone.

Maruti Suzuki Shareholding Pattern

AD 4nXdxuU1GpVkjahPCUMM8wfZKDfTvvFTTUuEa

As of March 2025, mutual funds hold a 15.54% stake in Maruti, and LIC holds a 4.75% stake. While the public shareholding is below 5%.

Maruti Suzuki Financials

Net Sales

Over the past five years, Maruti Suzuki has shown a robust increase in operating revenue. In FY25, the net sales of the company increased by 7.5% to ₹1.45 lakh crore. 

AD 4nXfoG24C9pWcQlnB738Lj BHE6o2vSium76RiDJrxlMKCzQyo1OQ64Ez86A1 y8 KNV7wgrnXBnkVPc99CeFZ0WKKa 4I9I206m4bN276di3g91XFC5 KvpCFN 8ZAyUkJhJnA7SJQ

The sales growth has been driven by volume growth. In FY25, it rose by 4.6% on a year-on-year basis to 2.2 million units. Domestic sales accounted for 85% of the total sales volume, with utility vehicles dominating the sales. While 15% of the total sales volume came from exports. 

AD 4nXfsoX7tqLtWfiJqrl2ikoZRbgw LtH 1Ho9P0SzZWe7l VpjH57YngIWQTuLiYDKd7ZLYuLwA2P1jd1sxHlLigkZ1itp1jmFPdJgIWvOZTfFW9UJlWZsjUOBURSbrV5LfulQgH7 w

Operating Profit

In FY25, the operating profit (Operating EBIT) of Maruti increased by 9.3% on a year-on-year basis to ₹14,626 crores. 

AD 4nXfsm1EvWSQIoYNnur5nm6ydy3xxJby1 I5 YluIxosQPr5 IGrTWN8C45waXvMWADHOs6sYXAgs4nHniCFQPXN0FR eg95Fs9ojo68O 8gGEep3nREcE0MEuOt5Wn85b669o JVAw

We analysed the company’s operating margin trend to see whether or not it is forgoing earnings in order to boost sales. Maruti Suzuki has continuously increased its operating profit margin over the last five years, demonstrating that the business is not forgoing earnings in favor of expansion. 

AD 4nXdoILVMKHwLWAcFqLoVF9dOJbgF 6Tdwg7ZfjeNmnLzwnndGzD5E5HCjBZ7K7mPC3nuF3zjjVdIXL0gbXYLhslA9pxSqUYyRvK ODFftBFhL555UYfh1h1pPsKPhuPGOI7y4UtuMA

Net Profit

Barring FY22, the net profit of Maruti has been consistently rising over the years. In FY25, Maruti Suzuki’s net profit increased 5.6% to ₹13,955 crores. 

AD 4nXdlTLCaKLXobGwUmhk1BcOA62Qhf4M1v6g1wnLM6Q2AJgmaD6ybVu2cAfybCA6URYRmEG iK2yMzWys0lmY4QBpQCCTO7dGpfHi5qI HXZLJfvpOviJyB65bvG

Maruti Share Price Analysis

Maruti share price has more than doubled in the last five years, rising from ₹5,919 in July 2020 to currently trading at ₹12,470 (9th July 2025). Its 52-week high level is ₹13,680. 

However, Maruti share price has been on a range-bound movement for the last one year, trading between the ₹11,000 and $13,500 levels.

AD 4nXcRN aYjmBnpBriBExq3n 8OexPdT0LIJdrYsOhwkwtoMTgK0n4oIFd7tuk6DfRIZgKB 95wvd7a6SvriHHl9 MBajXJnsPhmdZ2Po8 QyjRuUzYnUKyvJV0vSb3PANlpy BVHc A

The company has a consistent track record of paying dividends. In the last three financial years, it has paid ₹90 (FY23), ₹125 (FY24), and ₹135 (FY25) per share as dividends to shareholders. At the current market price of Maruti share price of ₹12,470, the dividend yield is 1%.

Maruti Share Price Valuation Metric Analysis

Earnings Per Share (EPS)

Over the last five years, the EPS of the company has more than tripled, rising from ₹140 in FY21 to ₹461 in FY25. 

FY21FY22FY23FY24FY25
EPS (₹) 140125266431461

Price-to-Book Value (P/B Ratio)

As of 9th June 2025, Maruti share price is trading at a price-to-book value of 4.1 times. The 5-year median price-to-book value is 4.5 times, largely indicating the stock is trading at a discount compared to its historical valuation. 

AD 4nXfpEAkKy 3bxgKyQkq0Bbgfscv91I7u7mctqQbH2RG4M ik9blTzmL7yW0 XumVt5qziiePw2VqBkigW d7IXeCnl5DaSxPgKEbmXVKaVqDLD

Source: Screener

Price-to-Equity Ratio (PE Ratio)

The stock is trading at a PE of 27 times, meaning, for every ₹1 of earnings, you are paying ₹27 as a premium. The median 5-Year PE is 36.4 times, which indicates the Maruti share price is trading at a discount compared to its historical valuation. 

AD 4nXcHa6mHc8IvuKFXda00sbUnHfIX8MsOR deD 2u AVHIOlzkNavvWOt NFyYrsr GuR3t0X Poc7SFzo01VBOIlXMRL4IoOfPg1HJBxSeArEoa8PtJ0t6Z2PwPn 7LQvRw zIbzQ

Source: Screener

Maruti Share Price: Future Growth Potential

Over the years, Maruti Suzuki has shown resilience in its business operations amid the uncertain global macro conditions and sectoral slowdown. The growth in Maruti share price has been driven by both revenue and earnings expansion. 

In FY25, Maruti Suzuki became the only passenger vehicle manufacturer in India to record the highest-ever annual sales of 2.23 million vehicles, including the highest-ever export of 3.32 lakh. 

Going forward, the management seems confident in continuing the growth momentum. Some of the major highlights of the Q4 conference call:

  • The automobile sector is expected to grow at a modest 1 to 2% for FY26. Maruti Suzuki is expected to perform better, supported by new SUV launches
  • Aiming to grow exports by at least 20% in FY26
  • Plan to launch two new passenger vehicles- the e-VITARA and a new SUV
  • e-Vitara is expected to start sales in the first half of FY26, with projected sales of 70,000 units for the year, largely coming from exports
  • The company aims to reach 28 models by the end of 2030
  • Capex is expected between ₹8000 to ₹9000 crores
  • New plant at Kharkhoda (250,000 capacity) expected to bring economies of scale

Few risks highlighted by the management:

  • Stagnant domestic demand in the entry segments. The hatchback segment’s share continued to shrink to 23.5% in FY25 from 46% in FY19.
  • Commodity price and steel pricing volatility 
  • Global trade barriers and supply chain stability
  • Lower profitability of electric vehicles, which implies potential headwind to overall company profitability as EV penetration increases

Overall, the company is well placed to capture the growth momentum. Closely following the earnings report, monthly sales data, and company updates can provide a clear clue on the long-term performance of the Maruti share price. 

FAQ

How has Maruti share price performed in the last five years?

Maruti share price has doubled in the last five years, rising from ₹5,919 in July 2020 to currently trading at ₹12,470.

Who is the owner of Maruti Suzuki?

Suzuki Motor Corporation of Japan holds 58.3% stake and is the promoter of the company. 

Does Maruti Suzuki have EV cars?

Maruti Suzuki is expected to launch its first electric vehicle e-Vitara in the first half of FY26. 

Despite falling revenues, HCC share price has seen a massive jump of over 500% in the last five years. The company is a premier engineering and construction firm specializing in infrastructure projects, including dams, bridges, tunnels, hydroelectric, and nuclear energy facilities.

It was involved in some major critical national infrastructure projects like Bandra Worli Sea Link, Kundankulam Nuclear Power Plant, Delhi Metro, and constructing multiple tunnels on the Udhampur-Srinagar-Baramulla rail line, including a 10.2 km tunnel on the Dharam-Qazigund section. 

So, what’s happening with the HCC share price, and why is the revenue declining? We will examine this in more detail. 

Brief Overview of HCC

Hindustan Construction Company (HCC) was established in 1926 by industrialist Walchand Hirachand. Headquartered in Mumbai, HCC operates in engineering and construction, real estate, and infrastructure development. The company specializes in large-scale infra developments like transportation, power, water, and urban development. 

HCC is known for its technical excellence, particularly in tunnelling, dam construction, and heavy civil engineering. It is one of the few Indian firms with the capability to undertake complex nuclear and hydro power civil works.

HCC Leadership Team

Mr. Arjun Dhawan is the Executive Vice Chairman. He serves on the Boards of the company and oversees operations spanning Engineering & Construction and Infrastructure Concessions.

Mr. Jasprit Singh Bhullar is the Managing Director and Chief Executive Officer at HCC. A seasoned construction business management professional, Mr. Jasprit has over 30 years of experience in the construction industry. Before joining HCC, he was with Multiplex Construction, a Brookfield Company, where he was working as Managing Director.

Mr. Rahul Shukla is the Chief Financial Officer and has been with HCC since 2010. He holds a degree in Mechanical Engineering and an MBA in Finance and Operations from MDI Gurgaon. At HCC, Mr. Shukla played a key role in fundraising initiatives, monetizing non-core assets, and completing the debt resolution plan. His career spans over 23 years, and he has worked in organizations like NTPC and L&T Power.

HCC Shareholding Pattern

AD 4nXfwQoi0goQsQdeohO617rEfQCxCitlTknC9WMoB4q2LRy 0c1pLPdKZumwkVeP7PKj4VKmy1QfaIPGxbhGor4ZwsbqlYgvCCfVBBribEoY rqyJtJ12XK75 2va8yQowtM03n S Q

HCC promoters have pledged 78.8% of their holdings, and a large part of the company is held by retail shareholders.

HCC Financials

In FY25, HCC’s income from operations declined 20% to ₹5,603 crores from ₹7,007 crores in FY24. The revenue has been on a declining trend since FY22. 

The decline in revenue is due to multiple factors, including project slowdowns and execution delays, and the divestment of international subsidiaries. 

AD 4nXdiFcOYKmamAck N6ucWVhGco6Z5MiwZDSdhoJBomhEy0ed6dPPf7Io1IzOGU0DitHxhqR0JMCIXFbO hsx86jTxbFk53CYl3FnAUwRiC8Rjx3OQbUpI

EBITDA

In FY25, HCC’s EBITDA saw an increase of 18.3% to ₹794 crores. EBITDA margin increased from 14.2% to 19.4%.

FY21FY22FY23FY24FY25
EBITDA Margin (%)11.616.913.614.1719.43

Net Profit

The net profitability of the company has been inconsistent over the years. In FY25, HCC’s net profit declined 78.7% to ₹112.6 crores from ₹529.4 crores. 

AD 4nXfhvW5fCdM8kpKYcc39j2mzs GeeFG s2LRqlMwmHdUhKQYi9MLiepTCh9KioLq9PbuO26SlJTiWaKs2Mccl6adTSvkSRcEAuaiUZZAT8HWl7HjtMQlWoQyf S5DMBnEBSNMZoQBQ

Earnings Per Share (EPS)

The EPS growth of HCC has been inconsistent over the years, swinging from negative EPS to positive EPS growth.

FY21FY22FY23FY24FY25
EPS (₹) -3.633.35-0.172.850.62

Key Financial Metrics

Return on Equity: HCC’s ROE declined from 35.91% in FY23 to 19.71% in FY24. 

Return on Capital Employed (ROCE): In FY24, the ROCE of the company improved to 22.4%, from 19.4% in FY23. 

HCC Share Price Analysis

As of 9th July 2025, the market cap of HCC is ₹5,336 crores. 

HCC share price has delivered an annualized return of 43% over the last five years. It rose from ₹6.45 per share in June 2020 to currently trading around the ₹30 level (19th June 2025). The 52-week high level of HCC share price is ₹57.50.

AD 4nXfSGFDtguPq9rTww23ZfeDOK30iQWjU3RvFkLepxI7fQg lZSEvK3MVnP3Iu6PyJGIpsclY ULmEx3pqv3hGS7KR 7gYNwseAHx9LWY0shy0zhI8I sqHl7TVIrK3G2KXVK1 NnkQ

The company has no history of paying dividends to its shareholders

HCC Share Price Future Growth Potential

Following are a few key positives and negatives that could impact HCC share price:

Positives

Strong order book growth: The company has a current order backlog of ₹11,852 crores and has planned ₹54,000 crores worth of bids for FY26.

Debt Restructuring and Financial Restructuring: In Q4FY25, the company repaid ₹534 crores of debt, with ₹134 crores of additional prepayment. Aim to reduce total debt to ₹2,500 crores by FY26 end. 

Successful Fundraising: The company completed a ₹350 crore rights issue and ₹600 crore QIP, enhancing working capital and growth execution. 

Negatives

Revenue Decline: HCC’s FY25 consolidated revenue declined 20% year-on-year, primarily due to the divestment of the Swiss subsidiary and lower execution volume. 

Muted Order Inflows in FY25: Only ₹3,800 crore converted into actual orders during FY25, lagging peers. Plus, the company has guided flat revenue growth in FY26, with growth expected only from FY27- 28 onwards. 

High Interest and Tax Costs: Despite margin expansion, high finance costs of nearly ₹600 crore and tax expense of ₹410 crore lowered net profit.

While financial discipline, debt reduction, and operational execution are major positives, flat near-term growth, sluggish order inflows, and legacy asset overhang could weigh on the stock. Share price movement will likely depend on order conversion in FY26 and execution pace. 

FAQ

Why is HCC share price so volatile?

HCC share price tends to be volatile due to its high debt levels, slow project conversion, and inconsistent profit growth. News on new orders, debt repayments, or claim recoveries often triggers sharp stock reactions.

How has HCC share price performed in the last five years?

HCC share price has given an annualized return of 43% over the last five years, as of 9th July 2025. HCC share price was trading below ₹10 five years ago, and has touched a high of ₹57.5 in July 2024. 

What is the future outlook for HCC?

HCC plans to scale its order book to ₹20,000 crore and has a ₹54,000 crore bid pipeline for FY26. Growth is expected to pick up from FY27, backed by the government infrastructure push and project execution.

DLF share price is witnessing renewed interest from investors. 

In a month, shares of the real estate company have increased by nearly 10%. 

If you look at the last 5 years, the stock price has returned close to 450%. 

DLF share price – 5 year performance

AD 4nXf4r56O4JHscGR2VBsC0VtlS0NavRNwT7S 3bU YoI87tFKOs3Zcq3Qz2Cpr4mmlwSXJ qNUgTUgC vmW2CtNex2w3vPlJQWG3 yy3kvrBftb1rkFgvYfF1m9DUg0ww4LAK7CUV5A

So, what is working in favor of DLF and what is the future growth potential? Let’s do a complete analysis. 

Business Overview of DLF

DLF has a legacy spanning over 75 years. The company was founded in 1946 by Chaudhary Raghvendra Singh, who pioneered the concept of planned urban development in India.

The company gained prominence by developing DLF City in Gurugram, which is now a landmark integrated township. It is primarily engaged in the development of residential, commercial, and retail properties across major Indian cities. 

DLF operates through two key business verticals:

Development Business: Majorly focused on the development of residential and commercial projects, including luxury and semi-luxury spaces. A few landmark residential projects include DLF Camellias and Dahilas in Gurugram, DLF Mall of India in Noida, etc. 

Rental Business: This business vertical is managed by its subsidiary, DLF Cyber City Developers. It leases high-end official space and retail assets, especially in Gurugram and other metro cities. The group enters long-term leases with MNCs and large Indian corporates that generate stable rental income. 

DLF also owns a high-quality, large land bank of nearly 200 million sq-ft of development potential, giving it an edge in future planning and development. 

The company follows an asset-light model and often enters into joint ventures or partnerships, like GIC for rentals. 

DLF’s business model balances short-term profitability via sales with long-term sustainability via rentals, which is the key to its strong financial position among real estate developers. 

DLF Leadership Team

Rajiv Singh is the Chairman and Whole-time Director. He has graduated with a B.S. (Mech) from MIT and has been part of DLF Limited since November 1981. 

Aakash Ohri is the Joint Managing Director and Chief Business Officer at DLF. A Harvard Business School alumnus, Aakash has been a part of DLF since September 1998.

Ashok Kumar Tyagi is the Managing Director at DLF Limited. He holds a PGDM degree from IIM Ahmedabad and a B.E. in Mechanical. Before joining DLF in 2008, he was Senior Vice President at Genpact. 

Sanjay Goenka is the Senior Executive Director and a key management professional at DLF. He has diversified hands-on experience in corporate finance, budgeting, corporate planning, restructuring, fundraising, etc. Mr. Sanjay Goenka has been with DLF since 1992 and is a qualified Chartered Accountant. 

Badal Bagri is the Chief Financial Officer at DLF and was appointed to the role in December 2024. Before, he was serving as the Business Head of the electronics vertical at Reliance Retail Limited. Before that, he was CFO at Bharti Airtel. 

DLF Shareholding Pattern

AD 4nXd3fhNYAaaIaeAb8fKvonQe1VvZVw840VVW2QzpAgrFES59Rox U9YqbV1tKi3JrLrhx6mtO7so1xM76pE7nB YfMgpr0f59nyCYQo QIrrlgLMO0TatUPTcGUKxv1meGGfs wftg

As of June 2025, DLF’s market capitalization is Rs 2.1 lakh crore, and the free float is Rs 54,236 crore, meaning only 25% of the shares are freely available for trading. 

DLF Financial Review

Total Income 

In FY25, DLF witnessed a 29% jump in net profit to Rs 8,996 crores from Rs 6,958 crores in FY24. It was the first big jump in 5 years, after stagnant sales growth since FY21. 

AD 4nXfJS6tSvJinFkqhbjeuyJrI6oIqgLWFIhD49JT9s4PEV4WweX46pgNq32gJXFHi7MysoSmuBTqgJ6vvPLHCdTHl19UH2rFAr KrBXa9Tb

EBITDA

DLF has improved its EBITDA in FY25, increasing from Rs 2,655 crores in FY24 to Rs 3,111 crores. EBITDA margin in FY25 was 39%. 

Net Profit

The net profit of the company also witnessed a massive jump in FY25. It increased from Rs 2,733 crores in FY24 to Rs 4,357 crores in FY25, registering a year-on-year growth of 60%.

AD 4nXdoFDPv0Di5k4oC6D MJ7EkUTNuuqjPQJyUwkARFCVxOzwefLF NgQFLUgNbPpXNr4qWomLd4d48oKZdwmehw O6kHu3THB012kw6DuG175diOn4YjQLCd0ww1Cug1SG276YCWO

Apart from these metrics, one important metric to check for a realty firm is its debt. There have been several instances in the past where a heavy debt burden took down the entire business of the firm.

For DLF, the company has marginal debt on its books. At the end of FY25, it had 0.11% debt on its total equity capital base

DLF Share Price Analysis

DLF share price was trading at Rs 161 level on 19th June 2020, and it rose to Rs 849 level on 23th June 2025. An increase of more than 5 times in five years. The 52-week high level of DLF share price is Rs 929.

The company has a consistent track record of paying dividends to shareholders. In FY24, it paid Rs 5 as dividends, and in FY25, it paid Rs 6 as dividends. At the current share price of Rs 849, the dividend yield of DLF is 0.58%. 

AD 4nXfTwgrL1cHORVb 80KjZ6R U11eUiqJmVA2AbKXK2vQSCiCluFsgTt3Hon meKB0tgHRXpKE92jlzvT51q5CTCkZLETHvth9Ex5Gye7KzWjDek2ypYSrQd88UXECBul3eFj2y vEg

DLF Share Price Valuation Analysis

Earnings Per Share (EPS)

DLF has shown a consistent rise in Earnings Per Share in the last five years. It rose from Rs 4.42 level to Rs 17.64 level, close to 4X growth in five years. This indicates a sharp rerating, which may have happened due to a sharp turnaround.

PeriodFY21FY22FY23FY24FY25
EPS (₹)4.426.068.2211.0217.64

Price-to-Book Value (P/B Ratio)

As of 23rd June 2025, DLF share price is trading at a price-to-book value of 5 times. The median 5-year Price-to-book value is 2.8 times, largely indicating the stock is trading at a premium compared to its book value. The premium may be due to improved business performance. 

Price-to-Equity Ratio (PE Ratio)

As of 23rd June 2025, DLF share price is trading at a PE of 46.4. Meaning that for every Rs 1 of earnings, you are paying Rs 46.4 as a premium. The 5-year median PE of the DLF share price is 56.6 times, indicating that the stock is trading at a discounted valuation compared to its historical averages. 

AD 4nXcRxbjB3OYJJRpx P70pJvmExJGwCWy9SRx

DLF Share Price: Future Growth Potential

DLF stands at a strong inflection point, backed by robust pipeline, stable rental income, and a deleveraged balance sheet. Here’s the breakdown of key growth drivers and risks that could impact DLF share price. 

Growth Drivers

Strong Rental Income: DLF operates over 32.9 million sq. ft. of Grade-A commercial space with ~95% occupancy. This provides steady, inflation-linked annuity income and adds long-term stability to cash flows.

Robust Land Bank for Future Development: DLF owns nearly large land bank of nearly 200 million sq-ft across prime locations. In FY25, the company booked Rs 21,223 crore in real estate projects, year-on-year growth of 44%.

Balanced Business Model: By combining cyclical residential development with stable rental earnings, DLF reduces reliance on one revenue stream. Its entry into mid-income housing also expands its market reach, driving volume growth. 

DLF has strategically reduced its net debt by following an asset-light model. It transferred assets and formed joint ventures, particularly with GIC. This has brought down financing costs and improved creditworthiness. The company has already achieved net debt zero and is working towards eliminating gross debt.

Ambitious Gross Margin Targets: The company has set a long-term gross margin target of 45% for development business, with super-premium and commercial segments projected at 30% margins.

Key Risks and Challenges

High Dependence on Luxury Sales: A significant chunk of FY25 bookings came from ‘The Dahlias’. Also, such luxury projects are priced at a premium, require timely completion and sustained demand. Any delay or market softening in luxury could impact cash flows and perception.

Interest Rate Risk: Real estate business is sensitive to interest rate cycles. Rising interest rates are detrimental for the growth of the sector. Also, the major part of the operation is concentrated in the NCR region. Any slowdown in homebuyer sentiment, especially in NCR, could weigh on future sales.

Modest ROE Outlook: While margins and earnings of the company are improving, historical ROE remains in low single digits (4–7%), raising questions about long-term value creation .

FAQ 

How has DLF share price performed in the last 5 years?

DLF has become a multibagger stock in the last 5 years. DLF share price gave an annualized return of 42% in the last five years, rising from Rs 161 level on 19th June 2020, and it rose to Rs 849 level on 23rd June 2025.

Is DLF a financially stable company for long-term investment?

Yes, DLF is a financially stable company. It has achieved a net debt-zero position and consistently improved its earnings per share (EPS). 

Is DLF totally into commercial real estate?

No, DLF is present in both residential and commercial segments. It balances its revenue stream by combining cyclical residential development with stable rental earnings from commercial properties.

Every time you invest in stocks or apply for IPOs, this company stands to gain, whether you make a profit or a loss.

This is Central Depository Services (India) Limited, a critical market infrastructure company in the Indian stock market. 

In recent years, CDSL has seen a boom in its business, all thanks to the financialization trend evolving in India. 

As a result, driven by strong growth in retail participation in the market, CDSL share price has surged more than 1200% in the last five years.

In this article, we will do a deep dive analysis of CDSL share price and analyse its future growth potential. 

CDSL – A Brief Overview

The primary business of CDSL is acting as a central depository in India. It offers demat services to investors in the stock market through a network of depository participants, which include stock brokers, banks, and other financial institutions. Therefore, CDSL electronically stores shares for investors and also acts as a clearing agent. 

It also offers value-added services like e-voting for shareholders, e-KYC for onboarding investors, and record-keeping for unlisted shares.

CDSL manages the highest number of demat accounts in India, managing over 15 crore accounts with securities worth over ₹71 lakh crore in custody.  

The company operates a transaction-based revenue model, earning fees from demat accounts, maintenance, transaction charges, corporate actions, and value-added services.

CDSL Management Team

Nehal Vora is the Managing Director and CEO of CDSL and has been leading the company since 2019. Before joining CDSL, he had worked with BSE, DSP, Merrill Lynch, and SEBI. Vora’s engagement goes beyond CDSL, and he has been a member of many SEBI committees.

Amit Mahajan is the Chief Technology Officer and has been with the company since October 2019. He is a BITS Pilani alumnus and has worked with organisations like BSE, Reliance Infosolutions, and Internet ExchangeNext.com. 

Girish Amesara is the Chief Financial Officer and has been with the company since November 2019. He is a qualified Chartered Accountant and has worked with organisations like the BSE and The Bombay Store before joining CDSL.

Rajesh Saraf is the Chief Data and Operations Officer and has joined CDSL in October 2022. Prior to joining CDSL, he was working with BSE Ltd. as Chief General Manager. 

Nayana Ovalekar is the Chief Regulatory Officer and has been with the company since October 2003. 

CDSL Shareholding Pattern

AD 4nXe4a5 3LmKNLQj5JjxT7y5n0Cqr3NG3vDW 9AsLhDl3Ft BdVDP3Y8Yfl5fGL91UNeDRpkdBfPpfEyzxXPCR9DDiTIDn5OKdlYOgi T3w82pW9Bxj y3D4sLCGX2D0iffLG3Qn

Mutual funds hold a 7% stake in CDSL, while insurance companies, including LIC, hold nearly 12.5% stake.

CDSL Financials

Total Income

CDSL reported an 8.5% growth in total income to Rs 984.5 crores in FY25, compared to Rs 907.3 crores in FY24. 

In the last five years, its revenue has witnessed a 146% jump, from Rs 400.6 crores in FY21 to Rs 984.5 crores in FY25. 

AD 4nXcCVQybo65NNmXzSCIfVk32 0vjBWJqVzpaMe9ZxSQAe82WysDSyJKqz8uBzxBrCa06zX0lctP97lDYzxMFtSjtnnrygICBnkTrEEc11uY6gqj6cjtxPIA0 JbWpS1j3u fz0gUKA

Net Profit

The company’s net profit improved by 25.4% year-over-year to Rs 526.3 crores in FY25, from Rs 419.65 crores recorded in FY24. And, since FY21, it improved by 161%, from Rs 201 crores. 

AD 4nXfcvwq9SiBjukRRJ1rvIezT9fd5R0cUwcu72ZeenWBAoJ6a3XwgiJvYH SUDeTy YtlIjgxQqrw82d2NsuZNHQDy251X3BbXJr3KhtFWPQanD7j3yODNzQarYJOX 1R Z sO2SFSQ

Key Financial Metrics

Debt-to-Equity Ratio: CDSL has no debt on its books, making it a debt free company

Return on Equity (ROE): In FY24, the ROE of the company improved to 34% from 29.97% in FY23.

Return on Capital Employed (ROCE): The ROCE of the company improved to 40.22% in FY24 from 35.58% in FY23. 

CDSL Share Price Performance Analysis

CDSL share price was trading at Rs 129 levels on 20th June 2020, and it rose to Rs 1,777 level on 6th June 2025. An increase of nearly 12.5 times in five years. 

The 52-week high level of CDSL share price is Rs 1,990.

AD 4nXd0uNFQFG6Hj4Hdyp621M7Cjui9WRwkqpL9HGk k97 KDhnZZITnPbsAnfN1VpaDFMkf5E29HnoN6bsw5lQU5hOre qJ61HTw7ijKX 8S7SO5mnqLBm dSdJG4vSLAmE82Z7bHrNA

Source: Tradingview

The company has a consistent track record of paying dividends to shareholders. In FY24, it paid Rs 22 as dividends, and in FY25, it paid Rs 12.5 as dividends. At the current CDSL share price of ₹1,776, the dividend yield of CDSL is 0.53%. 

CDSL Share Price Valuation Analysis

Earnings Per Share (EPS)

The EPS growth of CDSL has been consistent and has more than doubled in the last 5 years, from Rs 9.59 in FY21 to Rs 25.20 per share in FY25.

PeriodFY21FY22FY23FY24FY25
EPS (Rs)9.5914.8913.2020.0525.20

Price-to-Book Value (P/B Ratio)

As of 7th May 2025, CDSL share price is trading at a price-to-book value of 21.1 times. The median 5-year Price-to-book value is 14.2 times, largely indicating the stock is trading at a premium valuation compared to its book value. 

AD 4nXeV0m GqZH3LAoO5lq3GCcqDBK 9bwn7swsCDZzXY91GCgrsFXUVj9Uduj8sqpLhP1tWU59g3rFctOTEouXxYLS t2 rG1S4XN81o5JjLauMYu9yAUAykberdtfWWJO5dYGIh40

Source: screener

Price-to-Equity Ratio (PE Ratio)

As of 7th May 2025, CDSL share price is trading at a PE of 70.5. Meaning that for every Rs 1 of earnings, you are paying Rs 70.5 as a premium. The 5-year median PE of the CDSL share price is 47.8 times, indicating that the stock is trading at a premium valuation compared to its historical averages.

AD 4nXdlJtcElvAKRIY8KpG4DJ8g7dg0JpSBQQiyZOpjeoh2Kz8VdrSRkir0mQXZKXM8J96EtESuuQgiU4K6cFYk6XUpCFvTRJCk

Source: screener

CDSL Share Price: Future Growth Potential

CDSL share price growth over the last five years was driven by business and earnings expansion. 

The number of demat accounts has more than tripled since 2020, from 4 crore demat accounts in 2020 to over 15 crore at the end of March 2025. The rapid rise in account openings has fueled CDSL’s transaction volumes, data services, and fee income. 

Going forward, the outlook remains promising. Rising investors’ appetite for equity investments, mutual fund investments, and regulatory emphasis on digitization are providing structural tailwinds to CDSL. The growing IPO pipeline and steady capital market allocation activity also support CDSL’s core depository business. 

A unique strength of CDSL lies in its platform-based business model. Whether it manages 1 crore or 15 crore demat accounts, the incremental cost of servicing additional accounts remains marginal. This operating leverage allows CDSL to benefit from economies of scale, where revenue and profitability can grow much faster than costs, improving margins as volumes expand. This can also be seen in its higher operating margin. 

However, there are certain risks and challenges for the business. 

Regulatory Changes: CDSL operates in a highly regulated industry. Currently, CDSL has a market share of more than 70% in depository services. Therefore, any changes in SEBI regulations regarding pricing, competition, or market structure could impact the company’s business model or profitability.

Dependence on Market Sentiment: CDSL’s business performance is directly tied to stock market activity. A prolonged downturn in the market or reduced retail investor participation can lead to slower growth in demat account additions and transaction volumes. 

Increasing Competition: While NSDL is the only major competitor today, any potential new entrant or technological innovation in securities record-keeping could disrupt the current duopoly.

FAQs

What does CDSL do?

CDSL is a critical market institution company and is one of the two depositories in India that offer demat services to investors. It stores stocks and other financial instruments in electronic format. 

Is CDSL a government company?

No, CDSL is not a government company. It is promoted by entities like SBI and BSE, and is regulated by the market regulator, SEBI. 

How has the CDSL share price performed in the last 5 years?

CDSL is a multibagger stock, and in the last five years, it has returned more than 1250% to investors. CDSL share price rose from Rs 129 in June 2020 to Rs 1,777 in June 2025. 

Among the large IT companies in India, Tech Mahindra has largely performed better than its peers. As of 9th May 2025, Tech Mahindra share price has risen by nearly 180% in the last 5 years, while Infosys and TCS share prices have risen by 123% and 81% respectively. 

What has helped Tech Mahindra to outperform its peers? Will the growth momentum continue, and impact on Tech Mahindra share price? We will discuss it all in this article. Read till the end. 

Brief Overview of Tech Mahindra 

Headquartered in Pune, Tech Mahindra provides a wide range of services in IT, business process outsourcing (BPO), network services, and digital transformation. The company operates in 100+ countries and serves clients across BFSI, Telecom, healthcare, manufacturing, and retail. 

While TCS and Infosys’ core industry strengths are BFSI, retail, and manufacturing, Tech Mahindra has a strong focus on telecom & communication. The company serves 9 of the top 10 telcos across the prioritized markets.

In FY24, Tech Mahindra earned nearly ₹52,000 crores, 37% of its revenue from Communications and Media & Entertainment.

Tech Mahindra Management Team

Mr. Mohit Joshi is the CEO & Managing Director of Tech Mahindra. He joined the company in 2023, and before that, he was President at Infosys and had been with the company for 22 years. Mr. Mohit has an MBA degree from FMS Delhi and a bachelor’s degree in history from St. Stephen’s College, Delhi. 

Mr. Atul Soneja is the Chief Operating Officer and has joined the company in August 2023. Earlier, he was the CEO of CitiusTech. Mr. Atul has also served in the leadership ranks at Infosys as a senior vice president. He holds a B.Tech degree in Ocean Engineering and Naval Architecture from IIT Kharagpur. 

Mr. Rohit Anand is the Chief Financial Officer and has been associated with the company since November 2020. He has a rich experience of over 20 years in various functional roles. Before joining Tech Mahindra, he was the CFO of GE Healthcare. Mr. Rohit holds a BA and MA degree in Economics from the prestigious Delhi School of Economics. 

Mr. Richard Lobo is the Chief People Officer and has joined the company in January 2024. Prior to joining Tech Mahindra, he was with Infosys for nearly 23 years, and his last role in the company was Executive Vice President & Head Human Resources. Mr. Lobo did PGDM in Marketing & Finance from XIM Bhubaneswar and BE (Mechanical Engineering) from Manipal Institute of Technology. 

Tech Mahindra Shareholding Pattern

AD 4nXdTzWLSvGrQ6s 7bFk5JKIeW3qr3ZC j LmPwX8mP ikFtgo1pAr8T7U7Wwi8 7gMhKixRu0 2cWRWzjDGK72XlVViXV

Mutual Funds hold 17% stake in the company, LIC holds 10% stake, and retail individuals holding nominal share capital up to ₹2 lakh hold 6.7% stake. 

Tech Mahindra Financials

Revenue from Operations

In FY25, Tech Mahindra reported a marginal increase of 1.9% in revenue from operations, from ₹51,996 crores in FY24 to ₹52,988 crores. In fact, the company has failed to report any meaningful growth in revenue from operations in the last three years. 

Looking at the geographical distribution of revenue accounts, in FY24, the company earned 51% of its revenue from the Americas, 24% from Europe, and 24% from the rest of the world. In Q4FY25, the company also earned nearly 50% of its revenue from the US market. 

There is a risk that all IT companies face, which derives most of its revenue from the US market. We will discuss that in the article’s last section.

AD 4nXfKBzD1u9wdM5hk7cZmqMVvZBsMKCDJCrEfTrveej3h58ETc4cUPLAwuNwk6UiIGyqi2G92M 86Hm94VVK7 sMb9UgyRWwUzGh1dqpDPz7u9 JrBXCJydD70byMiC

EBITDA 

Tech Mahindra improved its operating margins in FY25. At the end of FY25, EBITDA rose by 40.8% to ₹6,991 crores from ₹4,964 crores in FY24. EBITDA margin improved from 9.5% to 13.2%.

However, the operating margins are still below the FY23 levels. It was 18% in FY22 and 15% in FY23.

AD 4nXcYcX5fWDoRfPdM6ptgcPeFogFuzRZd4PoY6MBo1SvEAymYpvoJfhppvvL0ahPl oTgTGUVKolMc3L2MeGicOTPdObCAiL5jpKp

Net Profit

The net profit of the company improved by 77.4% on a year-on-year basis to ₹4,253 crores in FY25 from ₹2,397 crores recorded in FY24. 

Key Financial Metrics

Current Ratio: Tech Mahindra’s current ratio declined slightly to 1.9 times in FY24 from 2.07 times in FY23.

Debt-to-equity Ratio: The company has marginal debt on its books. At the end of FY24, it had 2% debt on its total equity capital base. 

Return on Equity (ROE): In FY24, the ROE of the company declined significantly by 40%, from 14.69% in FY23 to 8.8% in FY24.

Return on Capital Employed (ROCE): ROE and ROCE are the vanity metrics that every smart investor tracks closely. It shows how much return the company is making on all invested capital. 

In FY24, ROCE of Tech Mahindra dropped to 11.89% from 19.72% in FY23. However, in FY25, the company improved its returns metrics significantly. ROCE improved from 14.6% in Q4FY24 to 22.6% in Q4FY25, reversing the loss.

Days Sales Outstanding (DSO): DSO is an important metric that shows in how many days the company collects money from clients. In this front, Tech Mahindra is constantly improving this metric. From 97 days in FY22, they have reduced it to 88 days. Lower DSO indicates better cash cycle management. 

Tech Mahindra Share Price Performance

Tech Mahindra share price was trading at ₹510 level on 15th May 2020, and it rose to ₹1,494 level on 9th May 2025. An increase on nearly 3 times in five years. The 52-week high level of Tech Mahindra share price is ₹1,808.

The company has a consistent track record of paying dividends to shareholders. In FY24, it paid ₹40 as dividends, and in FY25, it paid ₹45 as dividends. At the current share price of ₹1,494, the dividend yield of Tech Mahindra is 2.68%. 

Tech Mahindra aims to distribute 85% of its free cash flow as dividends or buybacks over the next five years. 

Tech Mahindra Share Price Valuation Analysis

Earnings Per Share (EPS)

The EPS growth of Tech Mahindra in the last five years is stable. After falling in FY24, it has recovered in FY25, but is still below the FY21 levels.  

PeriodFY21FY22FY23FY24FY25
EPS (₹)45.7357.2749.6024.1443.43

Price-to-Book Value (P/B Ratio)

As of 9th May 2025, Tech Mahindra share price is trading at a price-to-book value of 5.3 times. The median 5-year Price-to-book value is 4.4 times, largely indicating the stock is trading at a slight premium compared to its book value. 

AD 4nXdmZ0i VOaN0G0wym3CHbHW4NEhLgrVV7SRYLJV3zrml3lxgv6DT1m6JxZPX MNoHRGSEJwpbB7KYnqrZXtJtphkZwgn2dNNJVH4Yvm YixpYGJZhjEZd0pqQh6dSutU

Price-to-Equity Ratio (PE Ratio)

As of 9th May 2025, Tech Mahindra share price is trading at a PE of 34.4. Meaning that for every ₹1 of earnings, you are paying ₹34.4 as a premium. The 5-year median PE of the Tech Mahindra share price is 25.8 times, indicating that the stock is trading at a premium valuation compared to its historical averages.

AD 4nXd4XnCuFdxpCihT VVCtKjuYY94jTZy6KvMDvr6GVeX6pcetgFlURRtkC4oWj3XxLoJeRhecYg1Jckg4TMJRdj0qlO x9vM7hiY6FHp

Tech Mahindra Share Price: Future Growth Potential

Tech Mahindra has posted steady growth in FY25 despite challenging macro conditions. The steady performance was backed by large deal wins and the strengthening of its BFSI portfolio. It secured 15+ new logos (deals) in the BFSI space, including 3 in Fortune 500 companies. 

Tech Mahindra is improving its domain expertise in payments, wealth, and core banking. 

The value of the new deal wins in FY25 is $2.7 billion, 43% y-o-y growth, which gives some growth direction for the FY26 period. 

Backed by strong deals and a superior execution strategy, Tech Mahindra is aiming to expand its EBIT margin by 530 bps in the next two financial years, from 9.7% in FY25 to 15% in FY27. 

All in all, Tech Mahindra is in a fundamentally sound place to capture growth and opportunities in the next few years. However, one of the biggest risks is regional concentration. 

Tech Mahindra earns nearly 50% of its revenue from the US markets. The market is currently witnessing a slowdown-like condition. In the first quarter of 2025, the US GDP shrank by 0.3%.

In an article published in ET Wealth about the state of Indian IT companies, BNP Paribas stated, a 1.5 percentage point dip in the US GDP growth could hit Indian IT services revenue growth by 5.1 percentage points. Certainly, it is coming out as a major risk for Indian IT companies. 

Also, a strong rupee can squeeze margins for the companies as well. 

FAQ

  1. How has Tech Mahindra share price performed in the last 5 years?

    As of 9th May 2025, Tech Mahindra share price has given an annualized return of 23% in the last five years. Tech Mahindra share price rose from ₹510 level, recorded on 15th May 2020, to ₹1,494 level on 9th May 2025.

  2. What is the dividend of Tech Mahindra in FY25?

    Tech Mahindra has paid a dividend of ₹45 per share in FY25. Over the next five years, the company aims to pay 85% of its free cash flow as dividends and buybacks to shareholders.

  3. Who is the CEO of Tech Mahindra?


    Mr. Mohit Joshi is the CEO & Managing Director of Tech Mahindra. He joined the company in 2023. Earlier, he was with Infosys.

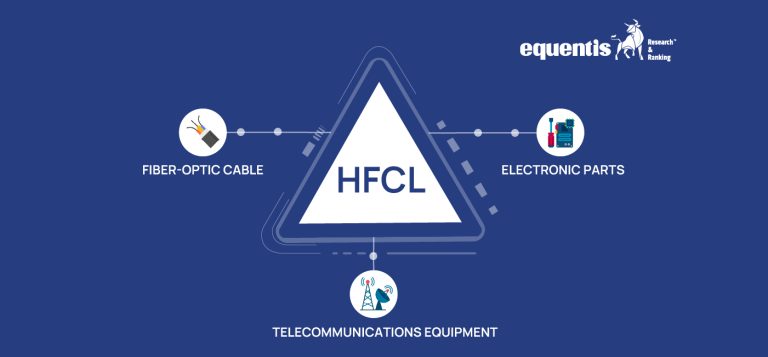
Himachal Futuristic Communications Limited (HFCL) is a leading optical fiber cable manufacturer in India, and its recent foray into defense manufacturing has attracted interest from many investors. HFCL share price, a small-cap stock, has also surged in the last five years and has multiplied investors’ wealth by over 10 times. 

But, the valuation concerns in small-cap stocks and uncertainty in the market due to geopolitics have impacted HFCL’s share price growth. The stock has corrected by almost 50% in the last six months. 

In this article, we will check out the future growth potential of HFCL share price and the overall business using several metrics. So, let’s start.

HFCL Business Overview

HFCL is primarily a telecom equipment manufacturing company. It deals in Fibre and Fibre Optic Cables, Routers, Wi-Fi access Points, Antennas, Network Management Solutions, and other Passive Networking Components.

The company was incorporated in 1987 and has played a crucial role in the expansion of 2G, 3G, 4G mobile networks in India over the years. A turnaround moment for the company came in 2021, when Reliance invested ₹138 crore in the company’s QIP, taking up a 5% stake. 

HFCL’s core business is divided into three segments- Public Communication, Railway Communication, and Defence Communication.

It is India’s number one optic fiber cable supplier, manufacturing over 14 million KM of optic fibre with five state-of-the-art manufacturing facilities and R&D centres. 

HFCL Management Team

Mr. Mahendra Nahata is the founder and managing director of HFCL and leads the company’s planning, execution, and operational strategies. An experienced and skilled leader in the telecom industry, Mr Nahata has served on the Board of Governors of many prestigious institutions like IIT-Bombay, IIT-Madras, and IIIT-Allahabad. He has majored in commerce at St. Xavier’s College, Kolkata. 

Mr. V.R. Jain is the company’s chief financial officer. He is a qualified chartered accountant and company secretary. He has vast experience in financial management and controls, managing and raising funds for business expansion, policy formulation, and many other areas of finance. Mr Jain has previously worked with Gujarat Heavy Chemicals Ltd. and TransAsia Carpets Limited. 

Mr. Harsh Pagay is Executive Vice President, leading the company’s  Optical Fiber (OF) and Optical Fiber Cables (OFC) business. He did his MBA from ICFAI Hyderabad and a B.Tech from MITS Gwalior, and before joining HFCL, he was with Teracom Limited as its CEO.

Mr. Jitendra Singh Chaudhary is the Executive President of communications and is responsible for the growth of the communication business, including Defense and railways. He is a PGDM holder from IIM, Calcutta, and a B.Tech from MMM Engineering College, Gorakhpur.

HFCL Shareholding Pattern

AD 4nXcuxpG0 TvSMKAtXQRgwzpeSwlvz9H19nP PsNc4OW6qk0UM2qIH7FdYztt HdPEkpZ 7HJQsa5X2NpOJusFz8g5gNRafYEu LmUOC0Vd7OiLCv3RaQuAcuB29ZBZfqgkqisQiIMQ?key=vQDGJuS6fAZg N 1AtEFBkk

Quant Mutual Fund holds an 8.30% stake in the domestic institution segment, and Reliance has reduced its stake to 1.57%.

The promoters have pledged their shares, and at the end of December 2024, 47% of their stake is pledged. These have been running since 2021 and were used as collateral to secure credit facilities from lenders. 

HFCL Financials

Total Income

HFCL’s revenue in FY24 declined 4.6% year-on-year to ₹4,566 crores from ₹4,790 crores. 

And, for the period 9MFY25 (April to December 2024), the revenue increased slightly by 2.8% to ₹3,308 crores from ₹3,216 crores recorded in the previous year. 

Nearly 97% of the revenue is derived from the telecom segment, 2% from Railways, and 1%Defenseefense. 

AD 4nXearyO5knCFsGSalxiixnIBjhLqLgapvUfp7QacHdMyM1uml93WKfAeCR6PNeYUj74topAlUAgbf6P NTl 1qNcp1XS 4w01VpXbBKQkRmoy2TX6Qgd3v8dr9rZ9FswX8gfM7P7?key=vQDGJuS6fAZg N 1AtEFBkk

Revenue Share Mix

The company’s revenue share from private customers in FY24 was 74%, which declined to 60%. Due to higher inflows of government orders recently, revenue from government orders are increasing. 

Second, the share of exports in revenue is hovering around 11%.

And, third, in FY24, product led revenue share has been 42%, in CY24, it has increased to 57%. The remaining share is coming from projects like EPC services. 

EBITDA

Despite the slight decrease in revenue in FY24, the company’s EBITDA has increased by 2.4%. And, in 9MFY25, EBITDA rose by nearly 12% to 529.08 crores. 

In FY24, the company’s EBITDA margin improved to 15.28% from 14.04% in FY23. And, for the 9MFY25, it further increased to 16.21%, highlighting operational efficiency. 

AD 4nXd5jenvmpfwvRW96Mf oYVPWLktG7gD5coKSirIgEMXnERddUBffdrv4NroBpONq6nzzYRFFPW7BHVblYFueFUOOJ3TvT 8zHbrk1CdesH7hiPSOxttBRDuQm7cqgu7IEno2Afq?key=vQDGJuS6fAZg N 1AtEFBkk

Net Profit

In FY24, the company’s net profit rose 6% to ₹337.52 crores. And, profit during the period 9MFY25 was ₹256.56 crores, increasing by 12.45% from ₹228.16 crores. 

PAT Margin in FY24 was 7.56%, rising from 6.70% in FY23. And, for 9MFY25, the PAT margin improved slightly to 7.86%. 

AD 4nXera8 V1n9P9h0cBnD3t7dUA90LiljECH8vDJwQyteMvlvLjJiwdvXorxtYM1Hh6WQtXwmwl79HQ9RNWkhy fFV1nIOPX3oc9BKrMmLfoOE 0GfqIAgVeyq UEXUllotDoMiMivHw?key=vQDGJuS6fAZg N 1AtEFBkk

Key Financial Metrics

Current Ratio: The current ratio of HFCL improved marginally to 2.04 times in FY24 from 1.94 times in FY23.

Debt-to-equity Ratio: The debt-to-equity ratio was stable at 0.20 times in FY24, while the debt service coverage ratio improved by 12% to 7.22%. 

Return on Equity (ROE): The ROE of the company increased slightly to 9.09 times in FY24 from 8.90 times in FY23. 

Return on Capital Employed (ROCE): The ROCE of the company slightly declined by 3.45% to 14.85%, from 15.36% in FY23. 

Other Important Metrics

Order Book

At the end of December 2024, the company’s outstanding order book stood at ₹10,410 crores. It was ₹6,151 crores at the end of September 2024. 

As seen in the image below, a large part of the order book consists of government orders under the Bharat Net program. 

AD 4nXc2qdpOiAnkHZGH3alSLOTEQrck bRZ50qmQMHdZtCl2Y8wUw4ii18D2DIHmhDsz66fEavH9ycicCi7nOgEV33rdL5LEBArwA3sZSBSNxxCbQegKBZfGNutyKDfUwoMXujFprO8VQ?key=vQDGJuS6fAZg N 1AtEFBkk

R&D Capabilities

HFCL has three state-of-the-art R&D centers in Bengaluru, Hyderabad, and Gurugram, with a team strength of 380 employees and around 10% of the total employees in the market. At the end of FY24, the total number of employees in the company was 3,547.

Now, looking at the R&D spending trend of the company, it has nearly tripled its expenses towards it from ₹89 crore in FY22 to ₹233 crore in FY24.

PeriodFY22FY23FY24
R&D expenditure as a percentage of total turnover 2.06%4.03%5.72%

HFCL Share Price Analysis

HFCL share price has underperformed the broader market and has lost nearly half its value in the last six months. However, if you look at the previous five years’ price action of HFCL share price, it is still a multi-bagger stock. It was a penny stock trading around ₹10 on 24th April 2020. As of 9th April 2025, the stock’s current value is ₹74.3 and has a market cap of ₹11,000 crores. HFCL share price reached an all-time high level of ₹171. 

The stock has a dividend payment history but has been on the lower side. At a current market price of ₹74.3, the dividend yield of HFCL is 0.27%. In FY24, it paid ₹0.20 per share as a dividend to shareholders. 

HFCL Share Price Valuation Metrics

Earnings Per Share (EPS)

The company’s EPS has improved over the last five years but has stagnated over the last three years, which has impacted HFCL’s share price growth. 

PeriodFY20FY21FY22FY23FY249MFY25
EPS (₹)1.771.862.272.182.291.79

Price-to-Book Value (P/B Ratio)

As of 9th April 2025, HCL share price is trading with a price-to-book value of 2.6 times. The median 5-year Price-to-book value is 3.6 times, indicating the stock is trading below the 5-year median P/B ratio. 

The stock’s P/B ratio has declined from the peak of 6.8 times, recorded in September 2024. 

hf2
Source: Screener

Price-to-Equity Ratio (PE Ratio)

As of 9th April 2025, HFCL share price is trading at a current PE of 29.3 times, which means that for every ₹1 of earnings, you are paying ₹29.3 as a premium. The 5-year median PE of the HFCL share price is 31 times, which means the stock is trading at a discount over a long duration.

The stock PE has fallen from 62.5 times, recorded in September 2024. 

AD 4nXfUe2 NWgSbTe1SZMQJRxForYie XvQoq6E0wIsJMk6XH3FBmRGuFWov5kfmMFMTqGkee1yVbYR7h nCeYdPrwECK1epGbpxizAVqAOHCHgVrYk5cxoTGufEr I8KTcfD9vam71SQ?key=vQDGJuS6fAZg N 1AtEFBkk
Source: Screener

HFCL Share Price What’s Next

HFCL’s share price has struggled for the last few months due to stagnated revenue, profit growth, and a sell-off in small-cap stocks. However, the company is well poised to capture growth because of the steps taken in the last few years.

  • HFCL’s entry into the defense business segment is a big boost for the company, and it has signed multiple contracts with the Indian armed forces. 
  • The company has invested significantly in ramping up its R&D efforts to drive innovation. R&D spending has tripled in the last three years. The company slowly migrates from project-led to product-led revenue growth to lower working capital requirements and drive margin expansion.
  • The company’s order book stands strong at more than ₹10,000 crore, however, concentration of government orders can be a risk. Driven by defense business and global expansion, the company aims to become a ₹10,000 crore revenue enterprise.

FAQs

  1. What does HFCL do?

    HFCL is an optic cable fiber manufacturer and a key supplier to India’s leading telecom operators and broadband providers. Recently, it entered the defense communication systems business.

  2. How has HFCL share price performed?

    Over the last five years, HFCL’s share price has become a multibagger stock, rising from ₹10 levels in April 2020 to ₹75 in April 2025. It is a small-cap stock with a market cap of around ₹11,000 crores.

  3. Is HFCL a profitable company?

    Yes, HFCL is profitable and has consistently improved its profitability metrics in the last five years.

India’s gaming and entertainment industry is booming, with live concerts and fine dining. Many startups, including Eternal (Zomato), have invested to capitalize on this Indian’s newfound interest.  One company that has established its dominance in the gaming and entertainment industry is Delta Corp. The company is a dominant casino gaming player in India and owns the biggest online poker platform, Adda52. 

However, due to business challenges in the last few years, Delta Corp share price has declined from ₹285 on March 17, 2022, to ₹87 on March 11, 2025, over the past three years. In its recent presentation, the management has reported an improvement in business performance. This article will analyze Delta Corp’s share price to understand its future growth potential. 

Let’s dive in 

Delta Corp Business Overview

Delta Corp is a leading casino gaming company in India, with over 2,000 live gaming positions, both offshore and onshore. The company has a strong presence in the states of Goa and Sikkim in the casino gaming segment and online skill gaming through the Adda52 poker platform. 

The offshore casino gaming is offered primarily through two vessels- Deltin Royale, Deltin JAQK, and Kings Casino. The onshore casino is offered at Deltin Suites in Goa.

The online gaming segment is divided into three sub-segments-  real-money games (RMG), mobile-centric/casual games, and e-sports.

The RMG segment includes real-poker, daily fantasy sports, and quizzing. Delta Corp is also into the hospitality segment, complementing the gaming business. The Deltin Daman is the largest hospitality project of the group, while Deltin Suites in Goa is equipped with a land-based casino.

Delta Corp Management Team

Mr. Jaydev Mody is the Chairman of Delta Corp and has over 40 years of experience in business growth and management. Mr. Mody, a Humanities graduate from Mumbai University, has played a key role in developing various significant and landmark real estate projects in and around Mumbai, including India’s first global mall, ‘Crossroads,’ in South Mumbai.

Mr Ashish Kapadia has been the Managing Director at Delta Corp since April 2009. He holds a bachelor’s degree in commerce and has established and managed various business sectors like paints, textiles, financial services, and aviation. 

Mr Anil Malani is the company’s President and Chief Financial Officer, with over 35 years of experience across multiple sectors. He has led the company as its ‘President – Operations’ for the past 14 years and was in charge of the group’s casino and hospitality businesses.

Mr Manoj Jain is the Chief Operating Officer and has been with the company since July 2008, holding several key positions. He is in charge of the entire operations of Delta Corp’s major portfolio of assets, Deltin Casinos & Hotels.

Delta Corp Shareholding Pattern

AD 4nXcE8C Ng0T orJQDZPTuCgRUTXk7wTFyvxY
HDFC Mutual Funds owns 8.33% of the company, while retail investors with shares worth up to ₹2 lakh own roughly 42%.

Delta Corp Financial Statement

Revenue From Operations

In FY24, the company’s revenue from operation declined by 4% to ₹925 crores from ₹964 crores recorded in FY23. And, for the nine months- April to December 2024, revenue from operations declined to ₹563 crores from ₹730 crores recorded in the same period the previous year. 

AD 4nXeDvfyIb0npuqNIGimSYWh1MyU1iBJYJixS7ZLuKvnkMn

Business SegmentsFY23FY249MFY249MFY25
Casino Gaming825813 (-1.5%)639522 (-18.3%)
Online Skill Gaming162147 (-9.5%)112124 (10.7%)
Hospitality Division4951 (4.54%)3736 (-2.7%)

Regarding the segment-wise business performance, Casino Gaming brings over 80% of the company’s revenue. In FY24, online skill gaming (Adda52) dragged revenue growth with a 9.5% de-growth in business. For the current financial year, the casino business is witnessing de-growth, and revenue from operations has been down by over 18% in the first nine months.

Net Profit 

In FY24, the company’s net profit declined by 6.56% to ₹245 crores from ₹262 crores recorded in FY23.  And, in 9MFY25, the company profit declined by more than 50% to ₹84 crores, compared to ₹172 crores recorded in the same period the previous year. 

AD 4nXeaSAIAHWWh DIbt2hI1FNP53IKpV66LFFUjkBFcBMQVYmOJPxg5 xI

Delta Corp Key Financial Ratios

Current Ratio: The company’s current ratio at the end of FY24 was 3.55 times, compared to 4.65 times in FY23. 

Operating Profit Margin (OPM): The OPM of the company reduced to around 25% in FY24, compared to 30.2% in FY23. 

Net Profit Margin: The net profit margin declined to 26.4% in FY24, compared to 27.20% in FY23. 

Return on Net Worth (RoNW): The RoNW of the company in FY24 was 13.81%, slightly higher than 13.25% in FY23.

Delta Corp is a debt-free company whose debt-to-equity ratio is not applicable. 

Delta Corp Share Price Analysis

Delta Corp share price has been an underperformer in the stock market over various periods.  The last five years’ returns of Delta Corp share price is around 40%, rising from ₹63 on 20th March 2020 to ₹88 on 13th March 2025. Delta Corp share price made an all-time high level of ₹328 on 8th April 2022. 

AD 4nXcVA1J5o1vSOcHwybY5BCq5HgR0Cum 7nTQbK6JRbhVjGYftw3KsOJJV86DzI5j0xjyqiJ0 4GI

The primary reasons for the fall in Delta Corp’s share price decline in revenue and the GST-related issues. The Indian government levies 28% GST on total money deposited with online skill gaming platform operators, significantly increasing tax impact on business. 

Delta Corp has a consistent track record of paying dividends to shareholders. In the last three years, the company’s dividend payout has been constant at ₹1.25 per share.  The company has maintained a dividend payout ratio of lower than 20%, which indicates it is a low dividend-paying company. 

Key Financial and Valuation Metrics

Earning Per Share (EPS)

The following is the last five-year EPS Of Delta Corp:

PeriodFY20FY21FY22FY23FY249MFY25
EPS (₹)6.85-0.902.519.779.123.15

The company’s EPS growth has been inconsistent in the last five years, which has impacted the growth of Delta Corp’s share price. 

For the 9MFY25 period, the EPS came in at ₹3.15, which is lower than ₹6.42, recorded for the same period the previous year. Therefore, for the full FY25, the EPS growth is likely negative, which may impact Delta Corp share price. 

Price-to-Equity VS Median PE

At the current Delta Corp share price of ₹88, the stock is trading at a PE of 20.1 times and 5 years median PE of 22.7, which indicates the stock is trading at a slight discount in price-earnings.

Source: Screener (As of 13th March 2025)

Price-to-Book VS Median Price-to-Book

Delta Corp’s current price-to-book value is 0.9 times, and the 5-year median price-to-book value is 2.2 times, which indicates the stock is trading at a significantly lower valuation. 

AD 4nXc41j30wy OCihx6pynJU0Fnb1cNLiaixE7Ifnz0iYsvDMgv1dRklNzxGAffWkT9RQ1O0PUtonx9wSh 3K28Q8XMEoO7P4cO5PrhiRXohAvXUMGscrkRu
Source: Screener (As of 13th March 2025)

Delta Corp SWOT

Delta Corp is a leader in the online rummy and poker segment with its Adda52 platform. The group now sells it to Head Digital Works, which operates A23 Rummy and A23 Poker. 

It is the second largest deal in the online rummy and poker segment, and Head Digital Works is acquiring it for ₹491 crores. Delta Corp had bought Adda52 for ₹182 crores in 2016. The development came as the segment witnessed intense regulatory scrutiny and higher GST levy, which was dragging on earnings for Delta Corp.

One of the significant threats for Delta Corp is its businesses, which are concentrated in two states, Goa and Sikkim. Further, regulatory hurdles restrict it from expanding to other states.

Another big threat is that being a discretionary spending sector, an economic downturn or slowdown in consumption negatively impacts the growth of the business. The company is witnessing a similar kind of situation in the current fiscal. 

However, to reduce the concentration risk- the company is diversifying to the real estate sector. Delta Corp is establishing a real estate development platform in a strategic partnership with Alpha Alternatives Fund Advisors LLP and Peninsula Land. It will invest ₹765 crores in  Residential Redevelopment projects and land parcels in the Mumbai Metropolitan Region (MMR).

To strengthen its casino business, the company is doubling its gaming positions from 2000 to 4000 with a capex of ₹350 crores by the end of FY25. 

FAQs

  1. What does Delta Corp do?

    Delta Corp is an onshore and offshore casino gaming company with a strong presence in Goa and Sikkim. The company is also big into online skill-based gaming and operates Adda52, an online poker and rummy platform.

  2. How has Delta Corp share price performed in the last 5 years?

    In the last five years, Delta Corp share price has underperformed the market and has given around 40% returns to investors, with share price rising from ₹63 on 20th March 2020 to ₹88 on 13th March 2025.

  3. Is Delta Corp a profitable company?

    Yes, Delta Corp is a profitable company and has zero debt in its book.

Frequently asked questions

Get answers to the most pertinent questions on your mind now.

[faq_listing]
What is an Investment Advisory Firm?

An investment advisory firm is a company that helps investors make decisions about buying and selling securities (like stocks) in exchange for a fee. They can advise clients directly or provide advisory reports and other publications about specific securities, such as high growth stock recommendations. Some firms use both methods, like Research & Ranking, India’s leading stock advisory company, specializing in smart investments and long-term stocks since 2015.

An investment advisory firm is a company that helps investors make decisions about buying and selling securities (like stocks) in exchange for a fee. They can advise clients directly or provide advisory reports and other publications about specific securities, such as high growth stock recommendations. Some firms use both methods, like Research & Ranking, India’s leading stock advisory company, specializing in smart investments and long-term stocks since 2015.

An investment advisory firm is a company that helps investors make decisions about buying and selling securities (like stocks) in exchange for a fee. They can advise clients directly or provide advisory reports and other publications about specific securities, such as high growth stock recommendations. Some firms use both methods, like Research & Ranking, India’s leading stock advisory company, specializing in smart investments and long-term stocks since 2015.

An investment advisory firm is a company that helps investors make decisions about buying and selling securities (like stocks) in exchange for a fee. They can advise clients directly or provide advisory reports and other publications about specific securities, such as high growth stock recommendations. Some firms use both methods, like Research & Ranking, India’s leading stock advisory company, specializing in smart investments and long-term stocks since 2015.