
Introduction:
In the world of technical analysis, traders rely on patterns to predict potential price movements. The Head and Shoulders chart pattern is one of the most reliable and widely recognized. This pattern is known for signalling a trend reversal, and when interpreted correctly, it offers traders a strategic edge in identifying possible market turning points.
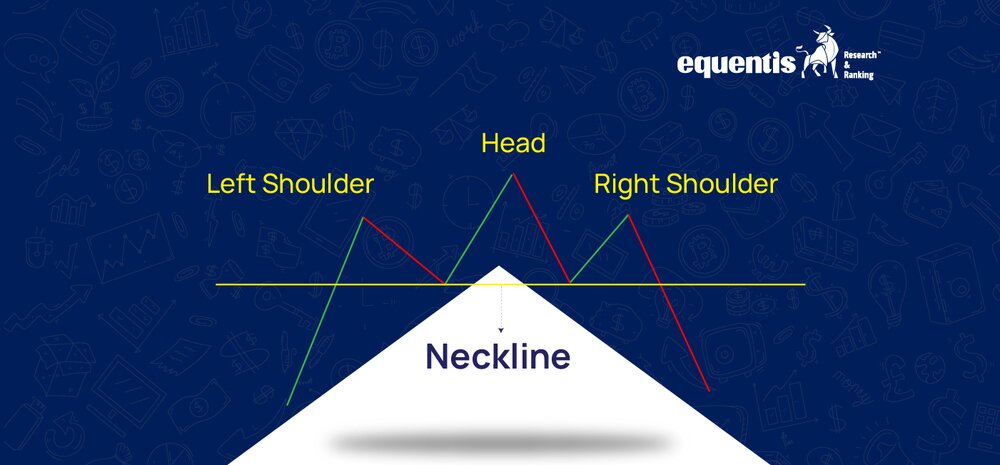
The chart Head and Shoulders pattern takes its name from its shape. It resembles a human figure, with a central peak (the “head”) flanked by two lower peaks (the “shoulders”). This formation typically appears after an extended upward trend and indicates that bullish momentum is weakening and a bearish reversal may be on the horizon. Its mirror image, the Inverse Head and Shoulders, suggests the opposite — that a downtrend may soon reverse into an uptrend.
Understanding the Structure of the Head and Shoulders Pattern
To identify a Head and Shoulders pattern in a price chart, traders look for three specific elements. Here’s a look at understanding the elements:
| Pattern Name | Details |
| Left Shoulder (Initial Peak) | This is the first significant rise in price, followed by a moderate decline. It indicates a temporary high within an ongoing uptrend, suggesting that buyers are still active, but selling pressure is starting to build. On the chart, this is labelled as the first “Shoulder” on the left. |
| Head (Highest Peak) | Risk management is key. Traders usually place a stop-loss just above the right shoulder to minimize losses if the pattern fails and prices rise again. This level warns that the bearish reversal may have been a false signal. |
| Right Shoulder (Lower Peak) | Following the head’s peak, prices decline and then make one last attempt to rise, but this upward move fails to surpass the height of the head, forming the right shoulder. It often resembles the left shoulder in height and shape, symbolising weakened buying interest and a maturing market top |
| Neckline (Support Level) | Risk management is key. Traders usually place a stop-loss just above the right shoulder to minimize losses if the pattern fails and prices rise again. This level warns that the bearish reversal may have been a false signal. |
| Breakdown Point | This is when the price decisively breaks below the neckline, confirming the pattern. It typically accompanies a spike in trading volume, indicating strong selling interest. Traders often wait for this moment before entering a short position or exiting a long one. |
| Target Price Calculation | To estimate how far the price might drop, measure the distance from the top of the head to the neckline, and subtract that from the breakdown point. For example, if the head is at ₹1,200 and the neckline is at ₹1,000, the difference is ₹200. Subtracting ₹200 from the neckline gives a target price of ₹800. This gives traders a practical benchmark to set profit-taking levels. |
| Stop Loss Strategy | Risk management is key. Traders usually place a stop-loss just above the right shoulder, so losses are minimized if the pattern fails and prices rise again. This level warns that the bearish reversal may have been a false signal. |
Why Traders Trust the Head and Shoulders Pattern
The Inverse head-and-shoulders pattern signals a potential bullish reversal, indicating a shift from a downtrend to an uptrend. This formation is essentially the opposite of the traditional head-and-shoulders pattern, with its structure resembling an upside-down version of the classic pattern. It consists of three troughs, the middle being the deepest, and is accompanied by two shallower troughs on either side.
The pattern begins with a price decline, which forms the first trough. Following this, the price experiences a rise, creating the first peak. After this upward movement, the price drops again, creating a second, deeper trough representing the pattern’s ” head “. The final phase of the pattern involves the price rising again to form a third, shallower trough, which completes the right shoulder.
The neckline, a crucial part of the pattern, is drawn by connecting the highs of the two peaks formed after the first and second troughs. The pattern is confirmed when the price breaks through this neckline, signalling a reversal from a bearish trend to a bullish one. This breakout is typically accompanied by increased volume, confirming the strength of the trend reversal.
Five Key Reasons Why the Head and Shoulders Pattern Is Considered Reliable
Traders trust the Head and Shoulders pattern for its effectiveness in predicting market reversals. Here are five reasons why it stands out:
- Indication of Market Exhaustion: The chart pattern Head and Shoulders forms when an uptrend loses momentum. As the right shoulder takes shape, it signals that the bullish trend is weakening and a reversal may be near.
- Shift in Market Control: The Head and Shoulders chart pattern illustrates a shift from bullish to bearish sentiment. Once the price breaks the neckline, it confirms that sellers have overtaken control, suggesting a downward trend.
- Breakout Confirmation: When the price breaks below the neckline, it validates the head and shoulders chart pattern, making it a strong entry point for short positions. This confirmed breakout often leads to a significant price drop.
- Market Psychology at Play: As the price declines after breaking the neckline, many traders who purchased during the upward trend are forced to sell, pushing the price closer to the Head and Shoulders pattern target.
- Volume and Trend Strength: The volume accompanying the breakout is crucial. A rise in volume when the price breaks the neckline supports the Head and Shoulders pattern as a reliable signal, confirming that the bearish reversal is gaining momentum.
Advantages and Disadvantages of the Head and Shoulders Chart Pattern
Here’s a comparison table highlighting the advantages and disadvantages of the Head and Shoulders pattern
| Advantage | Disadvantages |
| Clear Entry Point: The Head and Shoulders patterns offer a clear breakout point when the price crosses the neckline, making it easier to enter trades at optimal levels. | False Breakouts: The chart Pattern Head and Shoulders can sometimes present false signals, where the price breaks the neckline and reverses, leading to potential losses. |
| Widely Recognised: Traders commonly use the Head Shoulders Chart pattern, making it a well-understood formation that increases the reliability of its signal when identified correctly. | Choppy Market Conditions: In sideways or volatile markets, the Head and Shoulders pattern may not work as effectively, leading to unreliable signals. |
| Versatility Across Timeframes: The Chart Pattern Head and Shoulders applies to various time frames, allowing short-term and long-term traders to use it effectively. | Challenging to Identify: The Head Shoulders Chart Pattern can sometimes be difficult to recognise, particularly during volatile market conditions where price action fluctuates rapidly. |
| Defined Target Price: The Head and Shoulders pattern target is clearly defined by measuring the distance from the head to the neckline, offering a quantifiable exit strategy. | Confirmation Required: Traders must wait for confirmation of the pattern, such as a confirmed breakout, which can result in missed opportunities if the pattern fails to materialise. |
| Effective Risk Management: Traders often place a stop-loss just above the right shoulder in the Head and Shoulders patterns, helping to manage risk in case the pattern fails. | Effective Risk Management: Traders often place a stop-loss just above the right shoulder in the Head and Shoulders patterns, helping to manage risk if the pattern fails. |
In conclusion, the Head and Shoulders pattern is valuable for traders, signalling a potential trend reversal from bullish to bearish. By recognizing this chart pattern, traders can identify entry and exit points with a clear Head and Shoulders pattern target. However, waiting for confirmation and managing risk carefully is essential, as false breakouts can occur. When used correctly, this pattern offers a structured trading and risk management approach.
FAQs
What is the Head and Shoulders pattern?
The Head and Shoulders pattern is a technical analysis chart formation that signals a potential trend reversal. It consists of three peaks: the left shoulder, the head, and the right shoulder, with the neckline acting as key support. A break below the neckline confirms a bearish reversal.
How do you identify the Head and Shoulders pattern?
The pattern is identified by three peaks: the left shoulder (a rise and fall), the head (a higher peak), and the right shoulder (a peak lower than the head). A neckline connects the lows between these peaks, and the pattern is confirmed when the price breaks below the neckline.
What is the Head and Shoulders pattern target?
The Head and Shoulders pattern target is estimated by measuring the vertical distance from the top of the head to the neckline. This distance is then projected downward from the breakout point to set a target price.
Can the Head and Shoulders pattern be used in all markets?
Yes, the Head and Shoulders chart pattern can be used across various markets, including stocks, forex, commodities, and cryptocurrencies. It’s most effective on higher timeframes where the pattern is clear, reducing the chances of false signals.
Disclaimer Note: The securities quoted, if any, are for illustration only and are not recommendatory. This article is for education purposes only and shall not be considered as a recommendation or investment advice by Equentis – Research & Ranking. We will not be liable for any losses that may occur. Investments in the securities market are subject to market risks. Read all the related documents carefully before investing. Registration granted by SEBI, membership of BASL & certification from NISM in no way guarantee the performance of the intermediary or provide any assurance of returns to investors.

Jaspreet Singh Arora is the Chief Investment Officer at Equentis, where he heads a seasoned team of equity analysts and turns two decades of market experience into portfolios that consistently beat the benchmark. A go-to voice on cement, building-materials, real-estate, and construction stocks, Jaspreet previously ran research desks at leading brokerages, honing an eye for the metrics that truly move share prices. His plain-spoken analysis helps investors cut through noise and act with conviction. When he’s not deep-diving into earnings calls, you’ll find him unwinding over sports, weekend cricket or a good history podcast.