
Knowing how to read chart patterns can be a game changer for making wise decisions in stock market investing. By understanding different patterns, traders can identify potential short-selling opportunities and avoid risky trades. It is especially useful when analyzing high return stocks, as they often experience strong price movements.
One pattern that investors and traders often keep an eye on is the bearish flag pattern. Recognizing a bearish flag can help investors protect their capital and maximize profits in volatile markets.
This article will break down the bear flag chart pattern, explain its significance, and offer practical investment strategies.
What is the Bearish Flag Pattern?
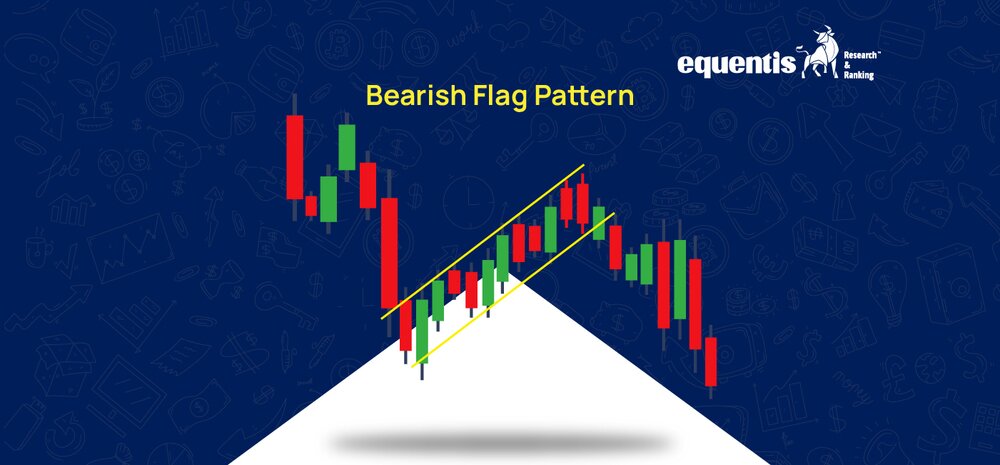
A bearish flag pattern shows that stock prices will likely keep falling. It begins with a sharp drop (the “flagpole”), followed by a short period where prices move sideways or slightly up (the “flag”). After this pause, prices usually drop again. The pattern looks like a flag on a pole, so it’s called a bearish flag.

How Does the Bear Flag Chart Pattern Form?
Understanding the formation of the bear flag chart pattern can help you identify it in real-time. The formation occurs in three stages:
- Flagpole: The pattern starts with a sharp price drop, usually caused by negative news, earnings reports, or general market sentiment. This drop creates the initial “flagpole.”
- Consolidation (Flag): The price moves sideways or slightly up within a small range after the sharp drop. This phase forms the “flag.” The flag should point sideways or slightly up, and trading volume usually decreases during this time.
- Breakdown: When the price falls below the flag’s lower edge, it confirms the pattern and signals that it will likely continue dropping.
Recognizing the Bearish Flag Pattern in Charts
To identify the bearish flag pattern in real charts, you should look for the following characteristics:
- A steep and rapid decline (the flagpole).
- A brief period of consolidation that forms a rectangular or parallel channel (the flag).
- A price move outside the flag confirms that the fall will continue.
This pattern is more reliable if trading volume is low during the flag and rises when the price drops below it.
Investment Strategies Based on the Bearish Flag Pattern
So, how can you use the bearish flag pattern to make better investment decisions? Here are some practical strategies:
1. Confirming the Trend
The first rule of trading with the bearish flag pattern is ensuring the market or stock is falling. Since the bear flag continues the trend, it works best when the market is weak. Look for stocks that have been dropping before the flag appears.
If you’re unsure whether a stock is falling, investment advisor services can help you understand the market trend.
2. Wait for the Price Drop
Wait for the price to fall below the flag’s lower boundary to confirm the bear flag pattern. This drop is a strong sign that the price will keep falling. Entering the trade after this move helps avoid false signals.
3. Set Entry and Exit Points
Once the price breaks below the flag, consider setting your entry point just under this level. If the pattern fails, place a stop-loss order slightly above the flag’s upper boundary to manage risk. For exit strategies, a common approach is to expect the price to fall by the same height as the initial drop (flagpole).
4. Use Volume as Confirmation
Trading volume is key to confirming the bear flag pattern. Ideally, the volume should be low during the flag phase and increase when the price breaks below. Higher volume at this point strengthens the signal that the price will continue falling.
5. Combine with Other Indicators
Additional technical indicators like moving averages or the Relative Strength Index (RSI) can be used to improve accuracy. The downward trend may continue if the stock is below its 50-day moving average.
However, if the RSI shows the stock is oversold, the price might temporarily rise, so be cautious before entering a trade.
6. Focus on High-Movement Stocks
Consider stocks with a history of sharp price drops and rebounds when using the bear flag pattern. These stocks offer better trading opportunities and stronger price movements.
Know More: SEBI Registered investment advisory | Stock investment advisory
Advantages and Disadvantages of the Bear Flag Pattern
Like any trading pattern, the bear flag has its advantages and drawbacks.
Advantages:
- Works in Various Markets – It can be applied to stocks, Forex, cryptocurrencies, futures, and commodities, making it a flexible tool for traders. This versatility allows traders to spot opportunities across different asset classes and adjust their strategies accordingly.
- Suitable for Different Timeframes – While it works best for intraday trading, it is also effective in longer timeframes like daily or weekly charts. Traders who prefer short-term strategies can use it for quick trades, while long-term investors can apply it to analyze broader market trends.
- Clear Entry and Exit Points – Traders know when to enter, exit, and set stop losses, which helps manage risk. The defined structure of the pattern allows traders to set their positions confidently, reducing emotional decision-making.
- Frequent Occurrence – The bear flag pattern appears often in market charts, giving traders multiple opportunities to trade it. Since it forms regularly, traders can practice identifying and executing trades based on this pattern without waiting for rare setups.
Disadvantages:
- Misidentification Risks – Incorrectly spotting the pattern can lead to losses.
- Difficult for Beginners – It requires confirming signals from indicators, candlestick patterns, and volume analysis.
- Reversal Risk – If the price correction exceeds 50%, it may signal a trend reversal instead of a continuation.
Conclusion
The bearish flag pattern can be a valuable tool for traders looking to capitalize on continuation trends in the stock market. Understanding this pattern and applying innovative investment strategies can enhance your chances of making profitable trades.
Remember, while the bear flag chart pattern can be a reliable signal of downward price movement, combining your analysis with proper risk management strategies is essential, such as using stop-loss orders and consulting investor advisor services for more insights.
Ultimately, chart patterns are just one piece of the puzzle regarding stock market investing. Alongside other patterns like the cup and handle pattern and rounding bottom pattern, the bearish flag pattern can provide the insights you need to make more informed investment decisions.
Related Posts


Disclaimer Note: The securities quoted, if any, are for illustration only and are not recommendatory. This article is for education purposes only and shall not be considered as a recommendation or investment advice by Equentis – Research & Ranking. We will not be liable for any losses that may occur. Investments in the securities market are subject to market risks. Read all the related documents carefully before investing. Registration granted by SEBI, membership of BASL & certification from NISM in no way guarantee the performance of the intermediary or provide any assurance of returns to investors.
FAQ
How do I spot a bearish flag pattern?
Look for a sharp price drop (the “flagpole”) followed by a brief period where the price moves slightly up or sideways in a small range (the “flag”).
What does a bearish flag pattern mean?
The price will likely keep falling after a short pause. Traders use this pattern to find short-selling opportunities.
How do I trade a bearish flag pattern?
Traders sell when the price drops below the flag’s lower boundary. A stop-loss is placed above the flag’s upper boundary to limit losses.
What are the downsides of a bearish flag pattern?
It’s not always reliable. To reduce risk, traders should confirm the pattern using other technical tools.
I’m Archana R. Chettiar, an experienced content creator with
an affinity for writing on personal finance and other financial content. I
love to write on equity investing, retirement, managing money, and more.