
Want to know about the fundamental analysis of JP Power? Read on. Jaiprakash Power Ventures Ltd, additionally referred to as JP Power Ventures, is part of the Jaypee Group. Following several years of repeated losses, the company has returned to profitability, with strong earnings growth. JP Power share price has also shed the image of being a penny stock, and investors are showing more interest in the company. In this article, we will do a fundamental analysis of JP Power’s share price and evaluate its long-term growth prospects.
Let’s start.
What Does JP Power Ventures Do?
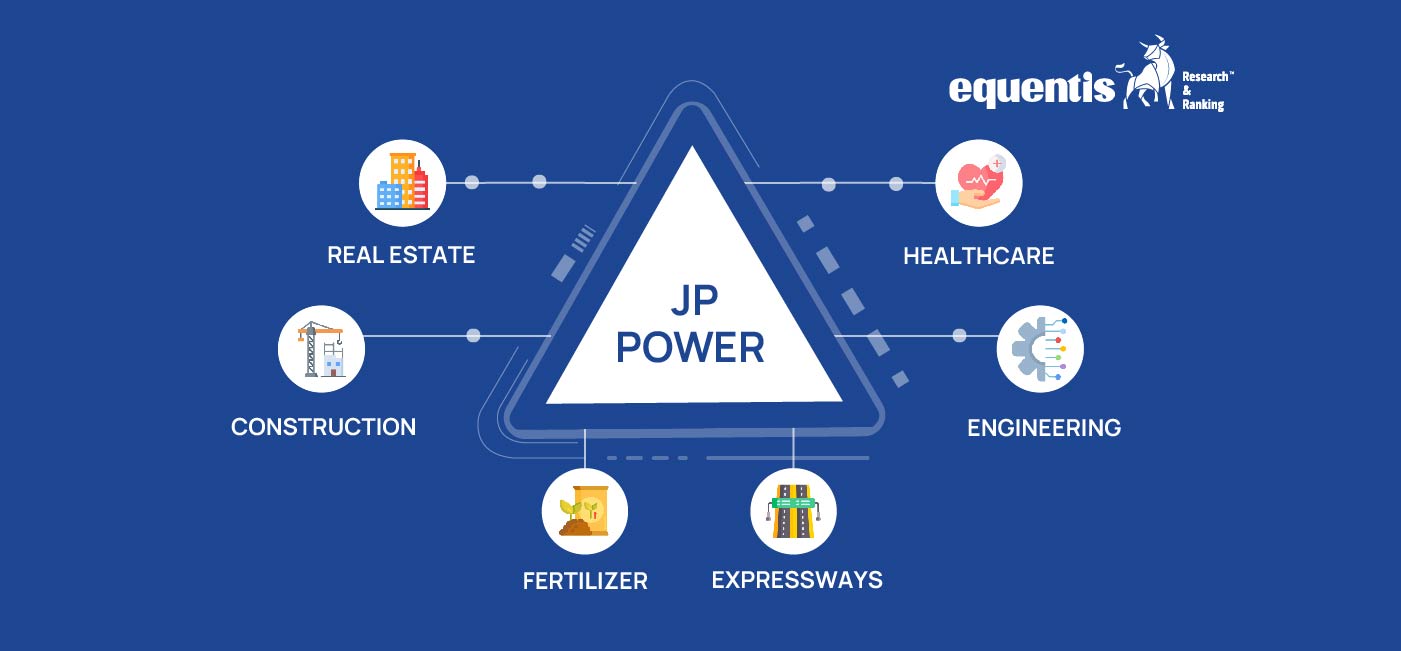
JP Power Ventures was incorporated on December 21, 1994 and is a part of the Jaypee Group, a diversified infrastructure conglomerate with interests in civil engineering, construction, cement, power, and real estate.
JP Power Ventures operates both thermal and hydropower plants and has aggregate power generation capacity of 2,200 MW.
Some of the notable projects of the company include 400 MW Vishnuprayag hydroelectric project, 500MW Bina thermal power plant, 2×660 MW Nigrie super thermal power project in Madhya Pradesh.
It has also implemented 1091 MW Karcham Wangtoo hydroelectric project, which is now owned and operated by JSW Energy, 1980 MW Bara Thermal Power Plant, which is now owned and operated by Tata Power, and many others.
The company is also involved in the business of setting up of transmission lines, coal mining and cement grinding plants to set up power projects and to carry on the business of generating electricity.
JP Power Management Team
Shri Manoj Gaur serves as the Chairman (Non-Executive) of the company’s Board. He is an established name in the Indian real estate business, serving as Chairman and Managing Director of Gaurs Group as well as Chairman of CREDAI’s Affordable Housing Committee (National).
Shri Suren Jain is the Managing Director and CEO of JP Power. He has been with the JP Group since 1993 and has held several high management positions in the group’s company. He has served as the Managing Director of JP Power Ventures since 2007. Shri Suren Jain received his BE degree in Production Engineering from Jawaharlal Nehru Engineering College.
Shri Madan Gopal Gupta is the Chief Operating Officer of JP Power Ventures and has joined the company in April 2019. He has over three decades of experience in India’s power sector and prior to joining JP Power, he was the CEO of Essar Power. Shri Madan Gupta has received his BE in Mechanical Engineering from NIT, Srinagar.
Shri M.K.V. Rama Rao is the Chief Technical Officer of JP Power Ventures and has vast experience in India’s power sector. He has held various positions in NTPC from 1978 to 2013 and has completed his M.Tech in Production Technology from IIT-Kharagpur.
Shareholding Pattern

Jaiprakash Associates is the company’s sole promoter entity, holding a full 24% ownership, with 79.20% of the shares pledged.
In the domestic institution segment, banks own 16.54% stake of the company, while LIC owns 1.38%.
JP Power Financial Review
Revenue From Operations
In FY24, revenue from operation increased by 18.66.8% to ₹6,763 crores from ₹5,787 crores in FY23.
And, in the first half of FY25, revenue from operations declined marginally by 2.5 % to ₹2,981 crores from ₹3,057.63 crores reported in the same period last year.

Net Profit
In FY24, JP Power recorded a massive 1758% rise in net profit to ₹1,022 crores, up from ₹55 crores in FY23.
The rise in net profit in FY24 is due reducing financing cost and one time exception gain of ₹461 crore
And, in the first half of FY25, net profit increased by 104% to ₹531.20 crores from ₹260.31 crores reported in the same period last year.

Key Financial Ratios
Current Ratio: The current ratio of the company improved by 53% in FY24 to 1.82 times from 1.19 times in FY23.
Debt-to-equity Ratio: During FY24, the company’s debt position improved slightly. The Debt-to-equity ratio of the company in FY24 improved to 0.37 times from 0.44 times in FY23. It was 3 times in FY19.
Other important metrics in FY24, such as Debt-service Coverage Ratio, Return on Equity, Return on Capital Employed, Return on Asset, and Net Profit Margin, are inflated and non-comparable due to an increase in post-tax earnings from one-time extraordinary gains.
JP Power Ventures Debt Status
At the end of FY24, the outstanding debt (including short and long term) of the company declined by 10.7% to ₹4,242 crores.

JP Power Share Price Analysis
The last five year performance of JP Power share price has been impressive, rising from ₹1.35 to ₹19 in the last five years, registering 1200% gains during the period.
JP Power share price all time high level is ₹137, which it made on 4th January 2008. In recent years, the company has stopped paying dividends and the last dividend it paid was in 2009.

Source: Tradingview
JP Power Share Price Valuation Score
Earning Per Share (EPS)
The following is the last five years Earnings Per Share of JP Power:
| FY20 | – ₹3.16 |
| FY21 | ₹0.39 |
| FY22 | ₹0.16 |
| FY23 | ₹0.08 |
| FY24 | ₹1.49 |
The company’s EPS growth has been inconsistent during the last five years. However, EPS growth has improved over the last two fiscal years. In the first half of FY25, EPS growth reached ₹0.60, up from ₹0.24 the previous year.
Price-to-book VS Median Price-to-book
The current price-to-book value of JP Power is 1.1 times, while the 5 year Media Price-to-book value is 0.6 times, which means, it is trading at slightly valuation compared to historical averages.

EV/EBITDA vs Median EV Multiple
EV/EBITDA compares a company’s enterprise value (EV) to its earnings before interest, taxes, depreciation, and amortization (EBITDA) to assess its worth and performance. It is an important valuation metric for asset heavy companies.
EV includes a company’s stock, debt, cash, and cash equivalents and has been viewed as the better alternative to market capitalization. A lower EV/EBITDA multiple indicates that the company is undervalued relative to its earnings.
JP Power EV/EBITDA multiple is 5.6 times, which is lower than the 5 years median EV multiple of 6.9 times.

Free Cash Flow (FCF)
In the last two financial years- the company has been able to generate free cash flow. It measures the cash generated after accounting for capital expenditure.
To calculate free cash flow, we need to deduct capital expenditure incurred during the year from net operating cash flow.
In FY24, the net cash flow from operations is ₹1,933 crores and capital expenditure is ₹184 crores, translating to free cash flow of ₹1,749 crores. It was ₹647.52 crores in FY23.
Rising free cash flow indicates improved financial health, operational efficiency, and investment potential.
JP Power Share Price Future Outlook
Once a debt-ridden company staring at a bleak future, JP Power has slowly charted a turnaround with improved operational efficiency and better financials. The company in the last few years has steadily worked on to reduce its debt through strategic debt restructuring, selling some of its core and non-core assets, which has helped to improve its finances significantly.
Looking at the company’s operational performance, JP Power is able to improve its operational efficiency.
However, the hydrology risks in hydro electric plants can reduce their efficiency, which can impact revenue.

Other big risks include ever changing carbon emission norms for fossil fuel based power plants, high volatility in fuel prices for thermal power plants, and lack of long-term PPA with utilities.
JP Power has recently received “Right of Exploration” for the Banda (North) Coal Block, where exploration activity is currently underway. This can add to revenue growth of the company.
Related Posts


Disclaimer Note: The securities quoted, if any, are for illustration only and are not recommendatory. This article is for education purposes only and shall not be considered as a recommendation or investment advice by Equentis – Research & Ranking. We will not be liable for any losses that may occur. Investments in the securities market are subject to market risks. Read all the related documents carefully before investing. Registration granted by SEBI, membership of BASL & the certification from NISM in no way guarantee performance of the intermediary or provide any assurance of returns to investors.
FAQ
How has JP Power share price performed in the last 3 and 5 years?
As of 4th December, JP Power share price in the last five years rose from ₹1.35 level to reach above ₹20 level, generating 68% compounded annual returns during the period.
Is JP Power a debt free company?
No, JP Power is not a debt free company. However, debt levels have decreased over the last five years, resulting in reduced interest costs and increased profitability.
Does JP Power pay dividends to shareholders?
In recent years, due to the financial crisis, JP Power stopped paying dividends to shareholders. The last recorded dividend payment was done in 2009.
I’m Archana R. Chettiar, an experienced content creator with
an affinity for writing on personal finance and other financial content. I
love to write on equity investing, retirement, managing money, and more.