
Want to understand the fundamental analysis of ONGC? Read on. ONGC is a leading oil exploration company in India but is struggling in the stock market. In the last 10 years, its share price has returned 1% annually to investors, but it is currently trading below its book value. So, can ONGC’s share price turn around and grow multi-fold? What is its future growth potential?
This article looks into the fundamentals of ONGC’s share price.
What Does ONGC Do?
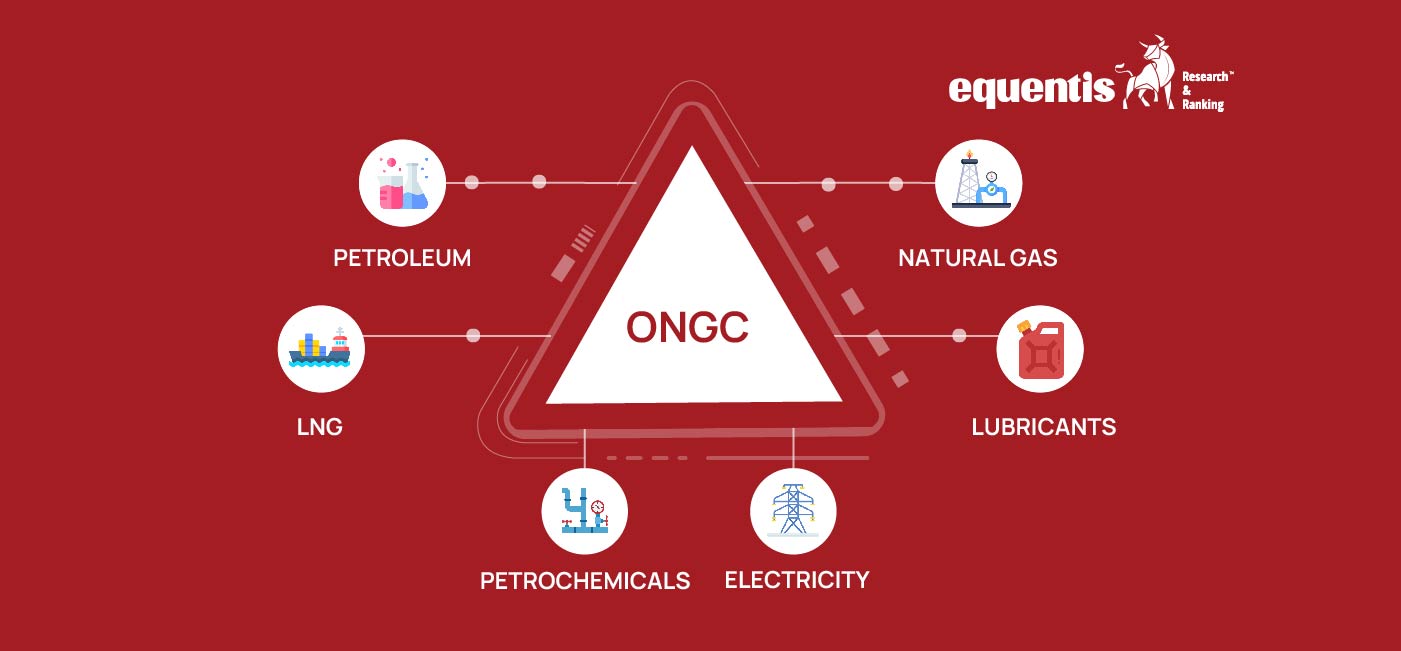
Oil and Natural Gas Corporation (ONGC) is India’s largest oil & gas exploration and production company with Maharatna status. The company is responsible for over 70% of India’s crude oil and 84% of natural gas production.
ONGC also has a strong international presence through its subsidiary, ONGC Videsh, which has projects in multiple countries. Through its subsidiaries, ONGC is present across all the value chains of hydrocarbons, including marketing, refinery, LNG, fuel transportation, etc. ONGC holds a 54.9% stake in Hindustan Petroleum.
ONGC Management Team
Mr. Arun Kumar Singh is the Chairman and CEO of ONGC and the ONGC group of companies. He assumed his role on 7 December 2022 and has a three-year tenure. Mr. Singh has over 37 years of experience in the oil and gas sector and was previously the CMD of Bharat Petroleum.
Mr. Om Prakash Singh is the Director (Technology & Field Services) and a mechanical engineer. He has over 36 years of experience in Indian oil and gas exploration and is an expert in deepwater drilling projects in India and abroad. Mr. Singh also chairs various Boards of ONGC subsidiaries.
Mr. Pankaj Kumar is the Director (Production) and has over 36 years of experience across ONGC’s business functions. He holds a B.Tech in Chemical Engineering from IIT Roorkee and a Master’s in Process Engineering & Plant Design from IIT Delhi.
Ms. Susma Rawat is the Director (Exploration), an industry veteran with over 34 years of experience. She heads the ONGC Carbon Management and Sustainability Group and is also a member of various inter-ministerial committees of NITI Aayog.
Mr. Vivek Chandrakant Tongaonkar is the Director of Finance and CFO. He has 37 years of expertise in various roles within the energy industry. He joined ONGC in March 1987 as an Assistant Executive Engineer (Electrical) after graduating from the College of Engineering in Pune. After completing an MBA (Finance) program at Symbiosis Institute of Business Management in Pune, he switched to ONGC’s Finance department.
Shareholding Pattern

In the Domestic Institution segment, mutual funds hold a 7.94% stake in the company, and LIC holds a 9.29% stake.
Financials Performance
Total Revenue
In FY24, ONGC group posted a total revenue of ₹6,55,259 crores, lower by 5.4% compared to the previous financial year at ₹6,92,903 crores.
And, in the first half of FY25, total income increased by 4.63% to ₹333,359 crores from ₹318,584 crores reported in the same period last year.

EBITDA
In FY24, EBITDA rose by nearly 35% to ₹1,15,057 crore from ₹85,320.8 crore in FY23.

Profit After Tax
In FY24, ONGC’s net profit increased by 67.7% to ₹57,101 crores from ₹34,047 crores in FY23.
In the first half of FY25, net profit declined by 41.5% to ₹19,688.6 crores from ₹33,665.89 crores reported in the same period the previous year.
The company’s operational and net profit margins were 41.25% and 29.28%, respectively, in FY24.

Key Financial Ratios
- Current Ratio: The company’s current ratio improved to 1.58 times in FY24 from 1.29 times in FY23.
- Debt-to-equity Ratio: The company has no debt in its books, so its debt-to-equity ratio is close to zero.
- Return on Equity (ROE): The company’s ROE declined by 12.5% to 14% in FY24 from 16% in FY23.
- Return on Capital Employed (ROCE): The company’s ROCE declined to 30.60% in FY24 from 39.82% in FY23.
ONGC Fundamental Analysis
In the last five years, ONGC’s share price has traded sideways with occasional price spikes, failing to deliver meaningful returns to its investors.
ONGC share price reached an all-time high of ₹345 in July 2024, from roughly ₹126 on December 13, 2019. Since then, it has traded with a downward bias.

Being a state-owned and profitable company, ONGC consistently pays dividends to its shareholders, sometimes paying more than 50% of its net profits as dividends.
In the last three financial years, the company has paid ₹10.5 in FY22, ₹11.25 in FY23, and ₹12.25 in FY24 as dividends to shareholders. At a current market price of ₹260 per share, the dividend yield is 4.71%.
ONGC Share Price Valuation Score
Earning Per Share (EPS)
The following is the last five years Earnings Per Share of ONGC:
| FY20 | ₹8.59 |
| FY21 | ₹12.96 |
| FY22 | ₹36.19 |
| FY23 | ₹29.18 |
| FY24 | ₹39.13 |
The company’s EPS growth has been inconsistent, and in recent financial years, it has moderated. It is important to note that a company’s share price rise is driven by its earnings growth.
Price-to-Book VS Median Price-to-Book
ONGC’s share price is currently 0.9, trading below its book value. The 5-year median price-to-book value is 0.7, which indicates that the stock has historically traded below its book value.

Price-to-Equity VS Median PE
The current PE ratio is 7.85, meaning investors are paying 7.85 times for every ₹1 of earnings. Looking at the historical averages, ONGC 5 year median PE is 5.7. It indicates that the company shares trade at a lower valuation than its long-term averages.
*Note: While stocks with a lower PE may look attractive initially, they indicate that investors are not ready to value the company higher because of its limited growth potential. If you look at all high-growth companies, such as Trent and Zomato, the valuation of them is expensive as they grow at a higher rate than the market, and investors expect to make more money in such stocks.

ONGC Share Price What’s Next
The company’s primary business activity is crude oil exploration and production, and its ability to expand depends on the successful discovery of oil and gas basins. For a very long time, the company has been unable to make major oil and gas discoveries, which has impacted its crude oil production capacity. Supply is depleting from its existing wells.

The table above shows that the company’s crude oil and natural gas production has consistently declined in the last five years.

In addition, the company’s proven oil reserves have also declined. In its FY24 annual report, the company stated that there is a natural decline in western offshore oil fields. It will focus on production enhancement by aiming to develop the Eastern Offshore Asset (EOA) early and gradually open wells by FY25.
Until new game-changing discoveries are made, the company plans to sustain current supply levels by effectively and efficiently managing existing oil fields.
As part of its diversification strategy and to improve its financials, ONGC is focusing on developing its petrochemical business, converting crude oil directly to high-value chemical products.
This Maharatna is also diversifying into renewable energy. By 2030, it will invest close to ₹10,000 crores in establishing 5GW of renewable energy capacity, including solar, wind, biogas, and pump storage projects. On the capex front, ONGC expects to invest between ₹ 33,000 crores and 35,000 crores in FY25, focusing on developing and redeveloping oil and gas fields.
Related Posts


Disclaimer Note: The securities quoted, if any, are for illustration only and are not recommendatory. This article is for education purposes only and shall not be considered as a recommendation or investment advice by Equentis – Research & Ranking. We will not be liable for any losses that may occur. Investments in the securities market are subject to market risks. Read all the related documents carefully before investing. Registration granted by SEBI, membership of BASL & the certification from NISM in no way guarantee performance of the intermediary or provide any assurance of returns to investors.
FAQ
How has the ONGC share price performed in the last 3 years?
As of 9th December 2024, the ONGC share price has given returns of 21% annually in the last three.
Does ONGC pay dividends to its shareholders?
ONGC has a consistent track record of paying dividends to its shareholders and has one of the highest dividend yields in the Nifty 50 companies. The company has paid ₹10.5 in FY22, ₹11.25 in FY23, and ₹12.25 in FY24 as dividends to shareholders.
Is ONGC a government company?
Yes, ONGC is a government company and a Manharatna company. It accounts for nearly 70% of India’s domestic crude oil production and 84% of natural gas production.
I’m Archana R. Chettiar, an experienced content creator with
an affinity for writing on personal finance and other financial content. I
love to write on equity investing, retirement, managing money, and more.