
Candlestick pattern analysis is one of the most powerful tools in technical trading. Whether you’re a beginner or an experienced trader, understanding candlestick formations can help you read market psychology, anticipate reversals, and make more informed decisions. In today’s fast-moving markets, price action often reveals more than indicators — and candlestick patterns sit at the heart of price action trading.
In this blog, we break down the top 20 candlestick patterns every trader should know, explain how they work, and highlight how a SEBI registered investment advisory can help you combine these patterns with research-backed strategies for long-term wealth building.
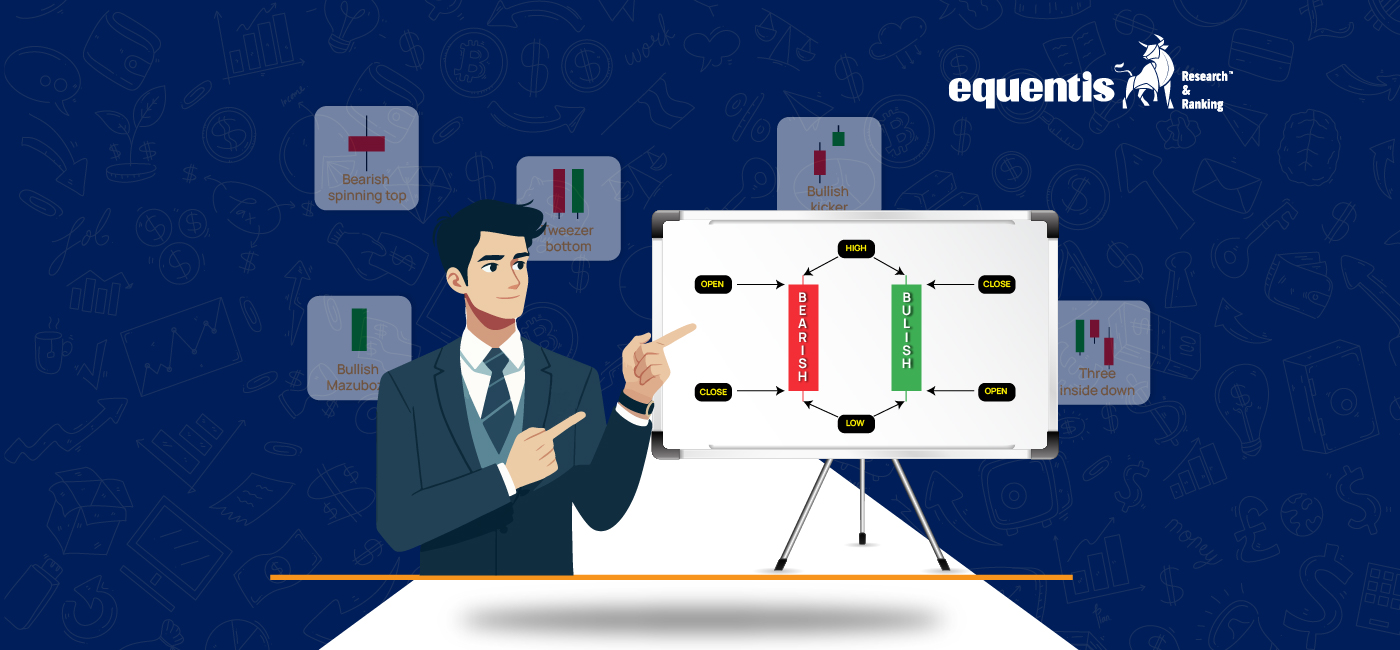
Before we dive into the patterns, remember: candlestick pattern analysis works best when combined with trend analysis, volume behavior, support/resistance levels, and disciplined risk management.
What Is a Candlestick Pattern?
A candlestick pattern is a visual representation of market sentiment formed by the price movement of an asset during a specific time period. Each candle shows the open, high, low, and close — and the resulting shapes or combinations create patterns that signal potential market direction.
These patterns help traders identify:
- Trend reversals
- Continuation signals
- Market indecision
- Bullish or bearish momentum
- Breakout confirmation
Mastering candlestick patterns gives traders an edge, especially in volatile markets where early signals matter.
Why Candlestick Patterns Matter for Traders
Candlestick patterns aren’t just shapes — they reflect trader psychology. When a pattern forms, it tells us who is in control: buyers or sellers. Learning them helps you:
- Time entries and exits more accurately
- Avoid false breakouts
- Identify trend strength
- Spot high-probability opportunities
- Reduce emotional trading
Most professional traders — including analysts in a SEBI registered investment advisory — rely on price action along with broader research for better decision-making.
Top 20 Candlestick Patterns Every Trader Should Know
Below are the 20 most important candlestick patterns categorized for easy understanding.
1. Hammer
A bullish reversal pattern that forms after a downtrend.
The long lower wick indicates strong buying pressure.
Signal: Trend reversal (Bearish → Bullish)
2. Inverted Hammer
Similar to the hammer but with a long upper shadow.
Shows buyers attempting to push the price up after a downtrend.
Signal: Bullish reversal
3. Bullish Engulfing
A powerful bullish reversal pattern where a green candle completely engulfs the previous red candle.
Signal: Strong bullish reversal
4. Morning Star
A three-candle bullish reversal pattern.
Indicates waning selling pressure and rising buying interest.
Signal: Major trend reversal
5. Piercing Pattern
The bullish candle closes more than halfway above the previous red candle’s body.
Signal: Potential bullish reversal
6. Shooting Star
A bearish reversal pattern with a long upper wick.
Shows buyers failed to sustain higher prices.
Signal: Bearish reversal at the top
7. Bearish Engulfing
A strong pattern where a red candle engulfs a previous green one.
Signal: Bearish trend reversal
8. Evening Star
A three-candle pattern signaling exhaustion in an uptrend.
Signal: Major bearish reversal
9. Hanging Man
Appears after an uptrend, resembling the hammer but with opposite implications.
Signal: Bearish warning
10. Dark Cloud Cover
A bearish reversal where the red candle closes below 50% of the previous green candle.
Signal: Reversal from bullish to bearish
11. Doji
Shows indecision — the open and close are nearly identical.
Signal: Potential reversal or consolidation depending on context
12. Spinning Top
Small body with long wicks.
Indicates indecision but less powerful than a doji.
13. Three White Soldiers
Three consecutive long green candles forming during a reversal.
Signal: Strong bullish momentum
14. Three Black Crows
Three long red candles indicating strong selling pressure.
Signal: Strong bearish trend
15. Harami Pattern (Bullish & Bearish)
The second candle is fully contained within the first candle’s body.
Signal: Potential trend shift or slowdown
16. Tweezer Top
Two consecutive candles with identical highs.
Signal: Bearish reversal at resistance
17. Tweezer Bottom
Two consecutive candles with identical lows.
Signal: Bullish reversal at support
18. Rising Three Methods
A bullish continuation pattern.
A long green candle, followed by small red candles, then another green candle.
Signal: Uptrend continuation
19. Falling Three Methods
A bearish continuation version of the rising three methods.
Signal: Downtrend continuation
20. Marubozu (Bullish & Bearish)
A candle with no wicks.
Bullish marubozu = buyers fully in control
Bearish marubozu = sellers dominant
Signal: Strong directional move
Bonus: Chart Patterns Traders Should Know
Candlestick patterns work even better when combined with chart patterns.
Here are two important ones related to your keywords:
Cup and Handle Pattern
The cup and handle pattern is a bullish continuation setup that resembles a teacup.
The “cup” forms after a rounded bottom, and the “handle” forms as a small dip before a breakout.
Usefulness:
- Excellent for identifying long-term breakout opportunities
- Works well on daily and weekly charts
- Often seen in strong growth stocks
Rounding Bottom Pattern
The rounding bottom pattern (also called the saucer pattern) shows a gradual shift from selling to buying.
Usefulness:
- Indicates long-term trend reversals
- Highly effective on longer timeframes
- Often precedes major multi-year rallies
Both patterns help traders anticipate large price moves — especially when combined with candlestick confirmations.
How to Use Candlestick Patterns Effectively
Candlestick patterns are powerful, but they must be used with a system. Follow these guidelines:
1. Combine with Market Structure
Support/resistance, trendlines, and volume enhance signal accuracy.
2. Look for Confirmation
Don’t act on patterns alone — wait for follow-through candles.
3. Analyze Volume
Volume spikes during reversal patterns increase reliability.
4. Practice Risk Management
Always set stop-losses below/above critical candle levels.
5. Use Tools
Platforms like an income tax calculator help traders plan finances, especially when reporting capital gains.
Why Work With a SEBI-Registered Investment Advisory?
A SEBI registered investment advisory brings research-backed stock recommendations, risk-managed strategies, and compliance-driven guidance. While candlestick patterns help in timing trades, research advisories help traders build long-term wealth through fundamentals, analytics, and disciplined frameworks.
Key benefits:
- Data-driven analysis
- Professional risk management
- Better portfolio allocation
- Long-term investment strategies
- Guidance to avoid speculation
For traders who want clarity and consistency, combining candlestick pattern analysis with professional advisory support gives a strong edge.
Final Thoughts
Candlestick patterns are essential for understanding market psychology and price movements. By mastering the top 20 patterns discussed here — along with key chart patterns like the cup and handle pattern and the rounding bottom pattern — traders can significantly improve decision-making and accuracy.
But remember: candlestick pattern analysis works best when used with sound research, risk management, and long-term planning. Whether you trade independently or work with a SEBI registered investment advisory, blending technical and fundamental insights is the smartest way to navigate markets.
Disclaimer Note: The securities quoted, if any, are for illustration only and are not recommendatory. This article is for education purposes only and shall not be considered as a recommendation or investment advice by Equentis – Research & Ranking. We will not be liable for any losses that may occur. Investments in the securities market are subject to market risks. Read all the related documents carefully before investing. Registration granted by SEBI, membership of BASL & certification from NISM in no way guarantee the performance of the intermediary or provide any assurance of returns to investors.
Frequently Asked Questions on Candlestick Patterns
1. What is a candlestick pattern?
A candlestick pattern is a price movement shown on a candlestick chart that traders use to interpret market sentiment. These patterns help identify potential reversal or continuation signals in stock price movements.
2. Why are candlestick patterns important for traders?
Candlestick patterns reveal the psychology of buyers and sellers. For traders using breakout trading, trend analysis, or short-term strategies, these patterns act as visual signals to enter or exit trades with better accuracy.
3. How many candlestick patterns should a beginner learn first?
Beginners should start with 8–10 essential candlestick patterns such as Doji, Hammer, Engulfing, and Morning Star before moving to advanced ones like Cup and Handle pattern or Rounding Bottom pattern.
4. Are candlestick patterns reliable for trading?
Yes, candlestick patterns are reliable when combined with volume, trend indicators, support-resistance levels, or tools such as an asset comparison tool. Relying only on patterns without confirmation may lead to false signals.
5. Can I use candlestick patterns for long-term investing?
Long-term investors typically focus more on fundamentals, assisted by investments advisory or a SEBI registered investment advisory. But candlestick patterns help identify better entry points.
6. Which candlestick pattern is the most accurate?
Patterns like Bullish Engulfing, Morning Star, Hammer, and Bearish Engulfing are considered highly reliable, especially near key support or resistance zones.
7. What is the difference between single, double, and triple candlestick patterns?
- Single patterns: Formed by one candle (e.g., Hammer, Doji)
- Double patterns: Formed by two candles (e.g., Engulfing, Harami)
- Triple patterns: Formed by three candles (e.g., Morning Star, Evening Star)
Each type provides different levels of confirmation.
8. Do candlestick patterns work in all markets?
Yes. Candlestick patterns work in equity, commodity, currency, crypto, and even index trading. However, liquidity and volatility impact accuracy.
9. Can I combine candlestick patterns with algo trading?
Absolutely. Many algo trading systems are built around candlestick-based rules, such as detecting breakouts or reversals automatically.
10. Is the Cup and Handle pattern a candlestick pattern?
While not a traditional candlestick pattern, the Cup and Handle pattern is a chart pattern often analyzed alongside candlestick structures to spot long-term bullish setups.
11. Is the Rounding Bottom pattern related to candlestick patterns?
The Rounding Bottom pattern is a price pattern that can be confirmed using candlestick formations at its breakout point.
12. Are candlestick patterns helpful for intraday traders?
Yes. Intraday traders rely heavily on candlestick signals for quick decisions, especially patterns like Marubozu, Doji, Inside Bar, and Engulfing.
13. Do I need advanced tools to trade candlestick patterns?
Basic charting platforms are sufficient. However, tools like a retirement planning calculator, asset comparison tool, or market scanners can support broader financial planning and market decisions.
14. Where can I learn candlestick patterns with expert guidance?
You can learn through books, online courses, or by partnering with a SEBI registered investment advisory that provides structured market guidance.
15. Are candlestick patterns still useful in modern algorithm-driven markets?
Yes. Even though algorithms dominate volume, candlestick patterns still reflect market psychology, making them relevant and widely used.

Jaspreet Singh Arora is the Chief Investment Officer at Equentis, where he heads a seasoned team of equity analysts and turns two decades of market experience into portfolios that consistently beat the benchmark. A go-to voice on cement, building-materials, real-estate, and construction stocks, Jaspreet previously ran research desks at leading brokerages, honing an eye for the metrics that truly move share prices. His plain-spoken analysis helps investors cut through noise and act with conviction. When he’s not deep-diving into earnings calls, you’ll find him unwinding over sports, weekend cricket or a good history podcast.