
Technical patterns often act as an early lens into changing market sentiment. When a widely tracked pattern begins to form on a stock that already has strong business fundamentals, investors tend to take notice. That is exactly what is happening with Godfrey Phillips India Ltd, where an inverted head and shoulders pattern on the charts is signalling a possible bullish turn.
At a time when market participants are increasingly blending technical analysis with fundamental conviction, this pattern has become an important talking point. For traders, it hints at momentum shifting. For long-term investors, it raises the question of whether price action is beginning to align with business strength.
Understanding the Bigger Picture
Godfrey Phillips India operates in the fast-moving consumer goods space, with cigarettes and tobacco products forming a significant part of its revenue. Over the years, the company has demonstrated relatively stable cash flows, strong brand recall, and consistent profitability, despite operating in a tightly regulated sector.
From a market perspective, the stock has seen phases of consolidation after sharp rallies. Such pauses are not unusual, especially in stocks that have delivered strong returns in the past. What matters is how the stock behaves during these consolidation phases. This is where technical patterns like the inverted head and shoulders gain relevance.
In the broader context, Indian equity markets have seen increased participation from retail investors who actively track chart patterns. As a result, technical signals often influence short- to medium-term price movements, sometimes even before fundamental triggers emerge.
What Is the Inverted Head & Shoulders Pattern?
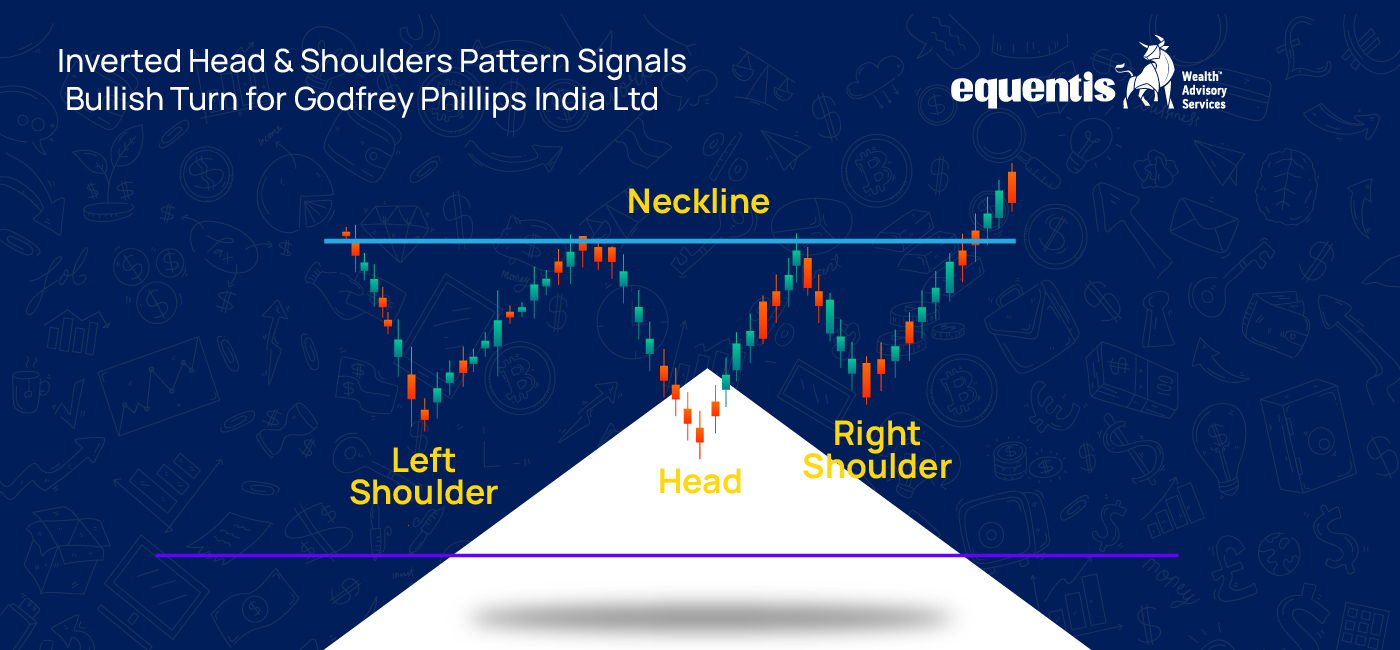
The inverted head and shoulders pattern is a classic bullish reversal formation in technical analysis. It typically appears after a downtrend or a prolonged consolidation phase.
The pattern consists of three troughs:
- The first trough forms the left shoulder
- The second, deeper trough forms the head
- The third trough forms the right shoulder
These troughs are connected by a resistance line known as the neckline. When the stock price breaks above this neckline with healthy volumes, it is often interpreted as a signal that selling pressure has eased and buyers are gaining control.
In simple terms, it suggests that the stock may be transitioning from weakness to strength.
Why This Pattern Matters for Godfrey Phillips India
In the case of Godfrey Phillips India, the inverted head and shoulders pattern has developed after a phase of consolidation. This indicates that despite intermittent selling pressure, buyers have repeatedly stepped in at higher levels, especially near the right shoulder.
The formation of this pattern suggests a gradual shift in sentiment. Earlier, sellers dominated rallies. Now, buyers appear more confident, absorbing supply and pushing the stock toward the neckline resistance.
From a technical standpoint, a sustained move above the neckline can open the door for further upside, as traders who follow chart patterns often enter positions after such breakouts.
Implications for Investors and Traders
For short-term traders, the inverted head and shoulders pattern provides a structured framework. It helps define potential entry levels, stop-loss zones, and upside targets based on the height of the pattern.
For positional investors, this development may indicate improving momentum after a consolidation phase. It does not guarantee returns, but it does improve the probability of a favourable move when supported by volumes and broader market strength.
Long-term investors may view this as confirmation rather than a trigger. Many prefer to see technical strength complementing fundamentals. In this case, steady cash generation and pricing power in the core business add comfort alongside the improving chart structure.
However, it is important to remember that technical patterns work best when they align with overall market sentiment. If the broader market turns risk-averse, even strong patterns can fail.
Opportunities Emerging from the Setup
The primary opportunity lies in momentum continuation. If the stock sustains above the neckline, it can attract fresh participation from traders and investors who were previously on the sidelines.
Another opportunity comes from sentiment shift. Stocks that break out of long consolidation phases often see re-rating as confidence builds. This can lead to better liquidity and improved price discovery.
Additionally, companies with strong balance sheets and predictable cash flows tend to find support faster during market corrections. This can limit downside risks compared to more cyclical or leveraged businesses.
Risks Investors Should Keep in Mind
Despite the bullish signal, risks remain. A failed breakout is one of the most common risks in technical analysis. If the stock moves above the neckline but fails to hold those levels, it can lead to false signals and short-term corrections.
Regulatory risk is another factor. The tobacco sector faces ongoing policy scrutiny, which can impact sentiment at any time, irrespective of chart patterns.
Valuation comfort also matters. Even technically strong stocks can struggle if expectations run ahead of fundamentals. Investors should remain mindful of price-to-earnings multiples and earnings growth visibility.
Conclusion: A Signal Worth Watching, Not Chasing Blindly
The inverted head and shoulders pattern on Godfrey Phillips India Ltd points toward a possible bullish turn after a period of consolidation. It reflects a gradual shift in control from sellers to buyers and signals improving momentum.
For traders, this setup offers a defined technical structure. For investors, it serves as a confirmation tool rather than a standalone reason to invest. The key lies in combining technical signals with a clear understanding of business fundamentals and sector risks.
As the stock navigates this phase, sustained price action above key resistance levels and stable volumes will be crucial. The coming weeks may offer clarity on whether this bullish signal translates into a durable trend or remains a short-term technical move.
Disclaimer Note: The securities quoted, if any, are for illustration only and are not recommendatory. This article is for education purposes only and shall not be considered as a recommendation or investment advice by Equentis – Research & Ranking. We will not be liable for any losses that may occur. Investments in the securities market are subject to market risks. Read all the related documents carefully before investing. Registration granted by SEBI, membership of BASL & certification from NISM in no way guarantee the performance of the intermediary or provide any assurance of returns to investors.

Parvati Rai is the Vice President of the Research team at Equentis. She has over 15 years of equity-research and strategy-consulting experience. A specialist in deep-dive valuations, financial modelling, and forecasting, she has built research desks from the ground up, by steering buy-side, sell-side, and independent coverage across sectors. When she isn’t fine-tuning models, Parvati unwinds on nature treks and mentors aspiring analysts.