
Picture yourself analyzing a stock which has remained rangebound for a few weeks, with slight ups and downs. Then one day, that stock price suddenly jumps, and it never looks back. For many traders, this is the type of movement you hope for. It often heralds a bigger price move, and being ready at that point can make all the difference.
These sudden movements usually occur when something changes – more buyers show up, news drops, or a major price level is breached. It’s like a pressure building behind a dam. Once the dam breaks, the water comes out quickly and powerfully. If you can spot early signs that these movements are on the way, you can ride that movement and grab a strong trade.
However, catching these price movements is not just about luck. It is about knowing what you want to see, knowing about price behaviour, and knowing how to confirm what you are seeing. If done properly, this technique can allow you to trade with greater confidence and better timing.
What is a Breakout Strategy in Trading?
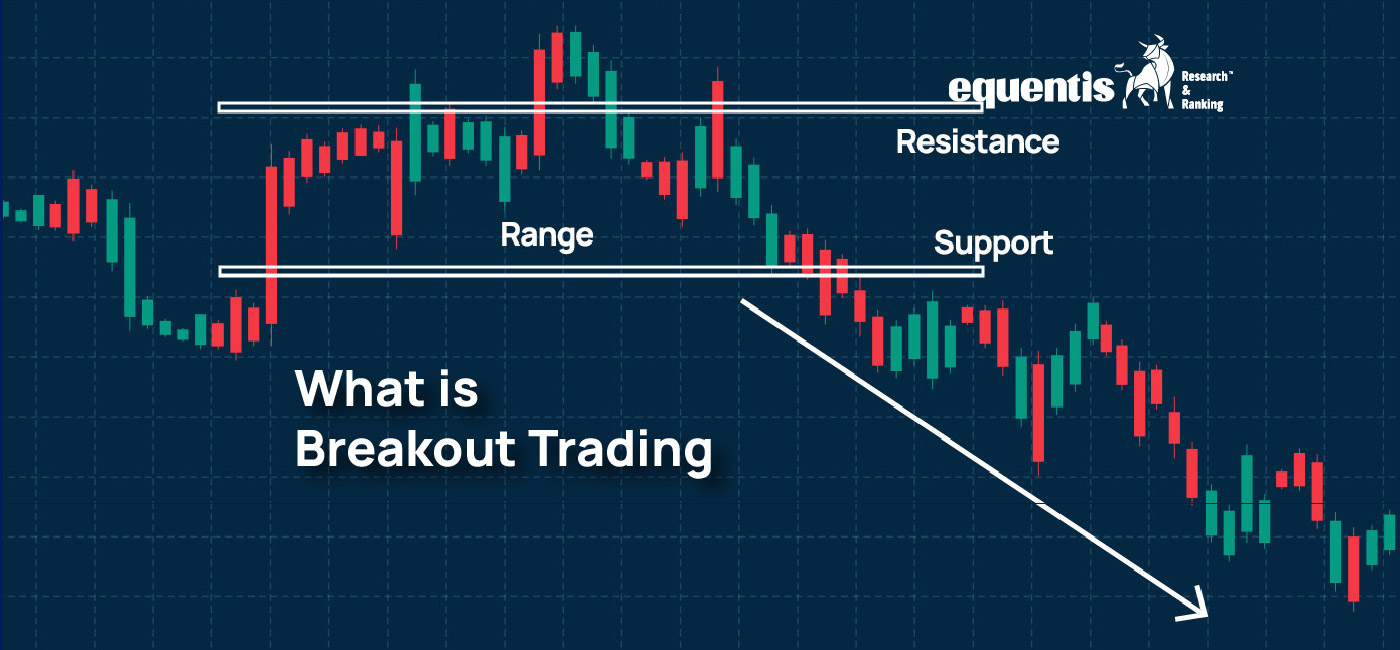
A breakout strategy means taking a trade when the price of an asset moves beyond a defined price support or resistance level with high volume. The assumption is that once the price breaks a significant level then it will follow that direction for some period of time, creating a possible trade opportunity.
For Example: Tata Steel, has been experiencing resistance at ₹130. For a few weeks now, the price may touch ₹130, only to fall back down. One day, the stock price breaks through ₹130 and closes at ₹134 instead. The stock also closed with unusually high volume too, above its average trading volume. A trader looking to use a breakout strategy would take this as a buy signal and then place a stop-loss short of ₹130 (possibly ₹128) and then look for gains, say to ₹140.
Different Types of Breakout Strategies (With Examples)
Breakouts can occur in many different forms depending on what was happening before the breakout in price activity, and what purpose the breakout served. Understanding what type of breakout will help the trader gauge breakout strength, possible future price direction and how reliable the breakout might be. Here are the primary breakdown types you are likely encounter in your trading world:
- Continuation Breakout: A continuation breakout occurs when price has gone through a consolidation period after a trend (up or down trend), then follows through in the same direction that the previous trend followed. A continuation breakout shows that there was just a small pause in the price action and that the markets will likely continue moving in the direction of the previous trend. Traders use continuation breakouts to enter the market when there is a confirmation of some continuation half way through the direction of the trend.
Example: Take for example a stock like Infosys that has been moving up every day. After a few days, the price is going pretty much sideways in a small range (flag) and then the price moves up and breaks out above the sideways movement. The breakout has taken place above the consolidation zone in strong volume. The breakout has confirmed that the buyers are still in control after the previous trend has just completed, and hence continue with their trade. Traders would enter the trade after the breakout, but not before having a stop order just below the consolidation zone.
- Reversal Breakout: Next comes reversal breakouts. A reversal breakout is the polar opposite of a continuation breakouts. A reversal breakout does not indicate a continuation of the original trend but actually a reversal of that trend. As the breakout can take prices that have been moving higher in a down trend or lower in an up-trend, and break out in the opposite direction, these often take place after formations like double bottoms, double tops or head and shoulders.
Example: Let us say Zomato has been in a long term down trend and formed a double bottom near ₹100. A break above the neckline resistance of this pattern, along with a higher volume, would signal a reversal breakout (the traders would think a new bullish trending market is just beginning and would likely go long above the breakout level).
- False Breakout (Fakeout): A false breakout is when price moves through a support or resistance level but quickly takes a reversal back. These often happen with traders entering with the expectation that a big move has begun. Traders can get trapped and lost due to being stopped out once price returns back to the range.
Example: If a stock like Tata Motors breaks above a main resistance level of ₹720, there are likely a lot of trades purchased anticipating a rally above ₹720. However, if that stock reverses back in a day or two, in this case back below ₹720 the false breakout scenario is well solidified; and this is exactly why confirmation (for instance, volume and confirmation candle closing) is so important prior to initiating your trade.
- News Driven Breakout: Occasionally, news events (and they can come from earnings, regulatory approval, or macroeconomic announcement) can create a sudden explosive breakout. Generally, they come with high volume and emotional market response. Breakouts of this nature can occur in either direction.
Example: If HDFC Bank announces better-than-expected results during a quarter and the stock gaps up and breaks out of a two-week resistance zone. Traders will generally have their “search tool” on looking for the news event to happen and then want to see post gap consolidation or a clear closing candle above the breakout level for confirmation.
- Volatility Breakout: This breakout technique uses volatility indicators rather than a chart pattern. Traders will wait for a period of low volatility before price breaks out of a range; the breakout is a sudden volatile expansion. Volatile trading involves using Bollinger Bands or Average True Range (ATR).
Example: Reliance Industries has posted tight Bollinger Bands and generated a wide green candle closing out of the upper band. Traders may utilize this price action as a volatility breakout; those types of traders would likely enter on volume spike confirmation.
Why Breakout Strategies Appeal to Traders: Major Advantages
Breakout strategies have been utilized by active traders for many years, as they have the potential to trigger strong moves in the market and allow traders to ride the momentum while taking the guesswork out of timing market entry and exit points.
Following are some of the most important advantages to breakout trading:
- Get in Early on Directional Moves: When traders breakout into new price levels, they can make informed rules based decisions that signal the start of a potential trend or directional move. These breakouts can help traders put themselves at the front of market moves and take a large piece of the trend, providing better potential returns.
- Clear Entry and Exit Levels: Breakout trading strategies typically use similar technical aspects: support and resistance levels, and consolidation. This provides clear entry levels and stop-loss or take-profit levels, providing a base framework to minimize emotion when there are structures and rules to take the guesswork – the ultimate way to have a disciplined trader mindset.
- Versatility Across Time Frames and Markets: Whether you are an intraday trader, swing trader, or long-term investor, breakout strategies are flexible and can be used to trade different time frames. Breakout strategies can also be applied to different asset classes such as equities, forex, commodities, and even cryptocurrencies (where a breakout may be used to confirm the structure of a price point hitting its first reasonable level).
- Volume as a Validating Sign: One of the key advantages in breakout trading, is the ability to correlate market price with market volume. If you have a potential breakout and price change, and have strong volume moves as well, it verifies interest and lessens the chance it may be false, more likely the price movement will remain sustainable.
- Avoiding Volatile Choppiness: Breakout traders typically stay side lined or inactive on price movements when price is in a consolidation or slumping sideways movement, as they can avoid taking low probability trades or false signals, typical in swirling choppy or volatile markets (which is likely the case, which is why they are choppy).
The Flip Side: Limitations of Breakout Trading
Even though breakout strategies can be a valuable tool for traders, there are limitations and potential issues you need to be aware of. Just like with any trading method, breakout trading has its risks and limitations. It is important for traders to be aware of limitations so they do not fall into common pitfalls and so they can manage expectations accurately.
- False Breakouts ‘Fakeouts’: Perhaps the single most common risk to breakout trading is the “fakeout” – when price crosses a significant level only to quickly reverse. Fakeouts can trap traders who enter too soon, or without confirmation, producing a loss. Low volume market conditions are more susceptible to fakeouts, as are trades being done on the news-based volatility that appears to have a price trend behind it.
- Whipsaws on Low Liquidity: In markets where volume/event risk, or when the timeframe is off-peak times, sudden price foreshadows above support or resistance levels may happen without the anticipated follow-through. Such price spikes, or whipsaws, produce stop losses and ultimately biased feelings, generating frustration, particularly for short-term traders.
- Overreliance on Technical Patterns: Breakout strategies are technically reliant upon technical patterns or indicators and although this can be helpful, it can also be misleading to both new and experienced breakout traders. These patterns and indicators do not account for fundamental outliers, surprise news in an earnings report, or external macro factors that can change direction suddenly.
- Delayed Confirmation = Missed Opportunities: One way for breakout traders to manage fakeouts is to wait for confirmation such as a close above the breakout level, or a surge in trading volume. However, what happens when a market becomes very volatile (bearish or bullish)? Many rational breakout traders may wait for confirmation which could result in missing the opportunity to take the best price and/or a significant move and affect their profit potential to recover enough from a potential draw-down.
- Sensitive to Market Sentiment: Breakout strategies are most reliable during trending markets, while they can become less reliable and more uncertain during periods of uncertainty or limited price fluctuation. If price events cause market sentiment to turn quickly, even the best missed-out breakout conditions can materialize into a breakout. These events may tend to have exploitive characteristics or show greater unpredictability.
Things to Look Out for When Trading Breakouts
Breaching a price range or support or resistance topology can be lucrative, but not without discipline and awareness. To raise the chances of success here are the major things to watch out for when trading a break.
- Volume Confirmation is Vital: Breakouts accompanied by volume make the breakout more likely to be real. Volume is an indicator of conviction; whether buyers are forcing the price up in a breaking upward move or sellers are dominating in a breaking downward move.
- Market Context Should Not Be Ignored: Breakouts thrive in trending markets or when volatility is present; they don’t belong in flat sideways markets where the price action can often be very tight in range. They also can be affected by global factors like news, earnings, economic announcements, and geopolitical situations, especially in more volatile or illiquid markets.
- Confirming Timeframes: Before initiating a break trade, look at timeframes above your standard execution timeframe. A break on a 15-minute chart or timeframe may not look as meaningful on the daily or hourly timeframes.
- Watch for Signals of Weakened Momentum Prior to the Break: When candles display long wicks, indecisive candles or candles that keep testing the same price level without significant movement (each are signs of dwindling momentum).
- Manage Targets and Accountable Stop Losses: Manage risk is non-negotiable; your stop-loss should be just below the breaking level for long trades and just above for shorts. If you enter late into an extended breakout it will lead to a larger stop-loss as profit diminishes with each leg up.
- Caution Around False Breakout Signals or Traps: Nonetheless, beware especially around psychological levels (₹10,000 or ₹100) which can lure order for institutional targets. Psychological levels typically trap retail stop-loss orders, a seemingly small breakout above or below a major price level may just be liquidity seeking to make an order.
Conclusion
Breakout trading is not simply about identifying a stock that breaks above a level of resistance or support, but about understanding the momentum of the move.
If you employ breakout strategies properly with verified confirmation signals, discipline, and risk management, they can create great trades with great profits. Jumping in blindly and without verification can lead to costly errors.
With the right belief, breakout trading can be an important part of your toolbox.
FAQs
Can an inexperienced trader practice breakout trading?
Certainly, an inexperienced trader can practice breakout trading, but the trader should start small and focus on learning. Inexperienced traders may want to consider working with virtual trading platforms first.
What is a false breakout and how can we minimize them?
A false breakout is when the price briefly trades beyond a key level hoping to build momentum to continue beyond that level, only to reverse directions. To minimize false breakouts:
- Wait for a candle to close beyond the breakout level.
- Look for volume confirmation.
- Don’t trade breakouts in low liquidity or during major news events.
Does breakout trading only apply to stocks?
Not at all. Breakout strategies can work for all asset classes of which stocks are just one. Breakout strategies can work in all asset classes including: forex, commodities, and cryptocurrencies. The principles will be the same, but some of the tools and timing may vary slightly for each market.
Disclaimer Note: The securities quoted, if any, are for illustration only and are not recommendatory. This article is for education purposes only and shall not be considered as a recommendation or investment advice by Equentis – Research & Ranking. We will not be liable for any losses that may occur. Investments in the securities market are subject to market risks. Read all the related documents carefully before investing. Registration granted by SEBI, membership of BASL & the certification from NISM in no way guarantee the performance of the intermediary or provide any assurance of returns to investors.

Yash Vora is a financial writer with the Informed InvestoRR team at Equentis. He has followed the stock markets right from his early college days. So, Yash has a keen eye for the big market movers. His clear and crisp writeups offer sharp insights on market moving stocks, fund flows, economic data and IPOs. When not looking at stocks, Yash loves a game of table tennis or chess.